You can quickly add horizontal lines to ggplot2 plots using the geom_hline() function, which uses the following syntax:
geom_hline(yintercept, linetype, color, size)
where:
- yintercept: Location to add line on the y-intercept.
- linetype: Line style. Default is ‘solid’ but you can specify ‘twodash’, ‘longdash’, ‘dotted’, ‘dotdash’, ‘dashed’, or ‘blank.’
- color: Color of the line.
- size: Width of the line.
The following examples show how to use this function in practice.
Add a Single Horizontal Line to a Plot
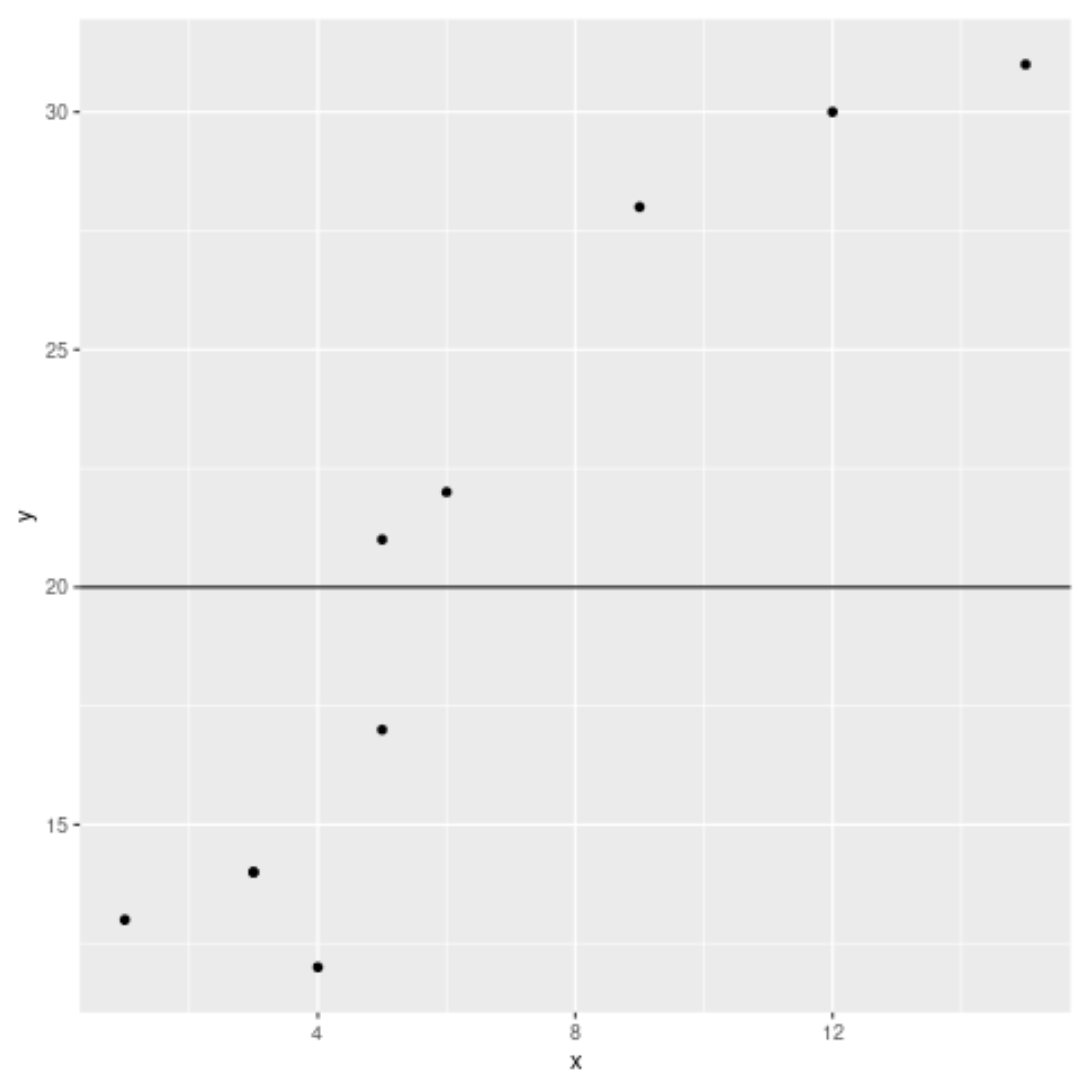
The following code shows how to add a single horizontal line to a plot:
library(ggplot2)

#create data frame
df frame(x=c(1, 3, 3, 4, 5, 5, 6, 9, 12, 15),
                 y=c(13, 14, 14, 12, 17, 21, 22, 28, 30, 31))

#create scatterplot with horizontal line at y=20
ggplot(df, aes(x=x, y=y)) +
  geom_point() +
  geom_hline(yintercept=20)
Add Multiple Horizontal Lines to Plots
The following code shows how to add multiple horizontal lines to a plot:
library(ggplot2)

#create data frame
df frame(x=c(1, 3, 3, 4, 5, 5, 6, 9, 12, 15),
                 y=c(13, 14, 14, 12, 17, 21, 22, 28, 30, 31))

#create scatterplot with horizontal lines at y = 10, 20, 30
ggplot(df, aes(x=x, y=y)) +
  geom_point() +
  geom_hline(yintercept=c(10, 20, 30))

Customize Horizontal Lines
The following code shows how to customize horizontal lines on a plot:
library(ggplot2)

#create data frame
df frame(x=c(1, 3, 3, 4, 5, 5, 6, 9, 12, 15),
                 y=c(13, 14, 14, 12, 17, 21, 22, 28, 30, 31))

#create scatterplot with customized horizontal lines
ggplot(df, aes(x=x, y=y)) +
  geom_point() +
  geom_hline(yintercept=c(20, 30), linetype='dashed', color=c('blue', 'red'))

Additional Resources
How to Add a Vertical Line to a Plot Using ggplot2
How to Plot a Linear Regression Line in ggplot2
How to Set Axis Limits in ggplot2