One error you may encounter in R is:
Error: ggplot2 doesn't know how to deal with data of class uneval
This error usually occurs when you attempt to use ggplot2 to plot two data frames at once, but fail to use the data argument within the geom_line() function.
This tutorial shares exactly how to fix this error.
How to Reproduce the Error
Suppose we have two data frames in R that show the number of sales made during specific hours on various days:
#create first data frame
df frame(date=c(1, 1, 1, 2, 2, 2, 3, 3, 3),
                 hour=c(1, 2, 3, 1, 2, 3, 1, 2, 3),
                 sales=c(2, 5, 7, 5, 8, 12, 10, 14, 13))

#view data frame
head(df)

  date hour sales
1    1    1     2
2    1    2     5
3    1    3     7
4    2    1     5
5    2    2     8
6    2    3    12

#create second data frame
df_new frame(date=c(4, 4, 4, 5, 5, 5),
                     hour=c(1, 2, 3, 1, 2, 3),
                     sales=c(12, 13, 19, 15, 18, 20))

#view data frame
head(df_new)

  date hour sales
1    4    1    12
2    4    2    13
3    4    3    19
4    5    1    15
5    5    2    18
6    5    3    20
Now suppose we attempt to create a line chart to visualize the sales grouped by day and hour, using the color blue for the first data frame and red for the second data frame:
library(ggplot2)

#attempt to create line chart
ggplot(df, aes(x=hour, y=sales, group=date)) +
  geom_line(color='blue') +
  geom_line(df_new, aes(x=hour, y=sales, group=date), color='red')

Error: ggplot2 doesn't know how to deal with data of class uneval
We receive an error because we failed to use the data argument within the second geom_line() function.
How to Fix the Error
The way to fix this error is to simply type out data within the second geom_line() argument so that R knows which data frame we’re attempting to plot.
library(ggplot2)

#create line chart
ggplot(df, aes(x=hour, y=sales, group=date)) +
  geom_line(color='blue') +
  geom_line(data=df_new, aes(x=hour, y=sales, group=date), color='red')
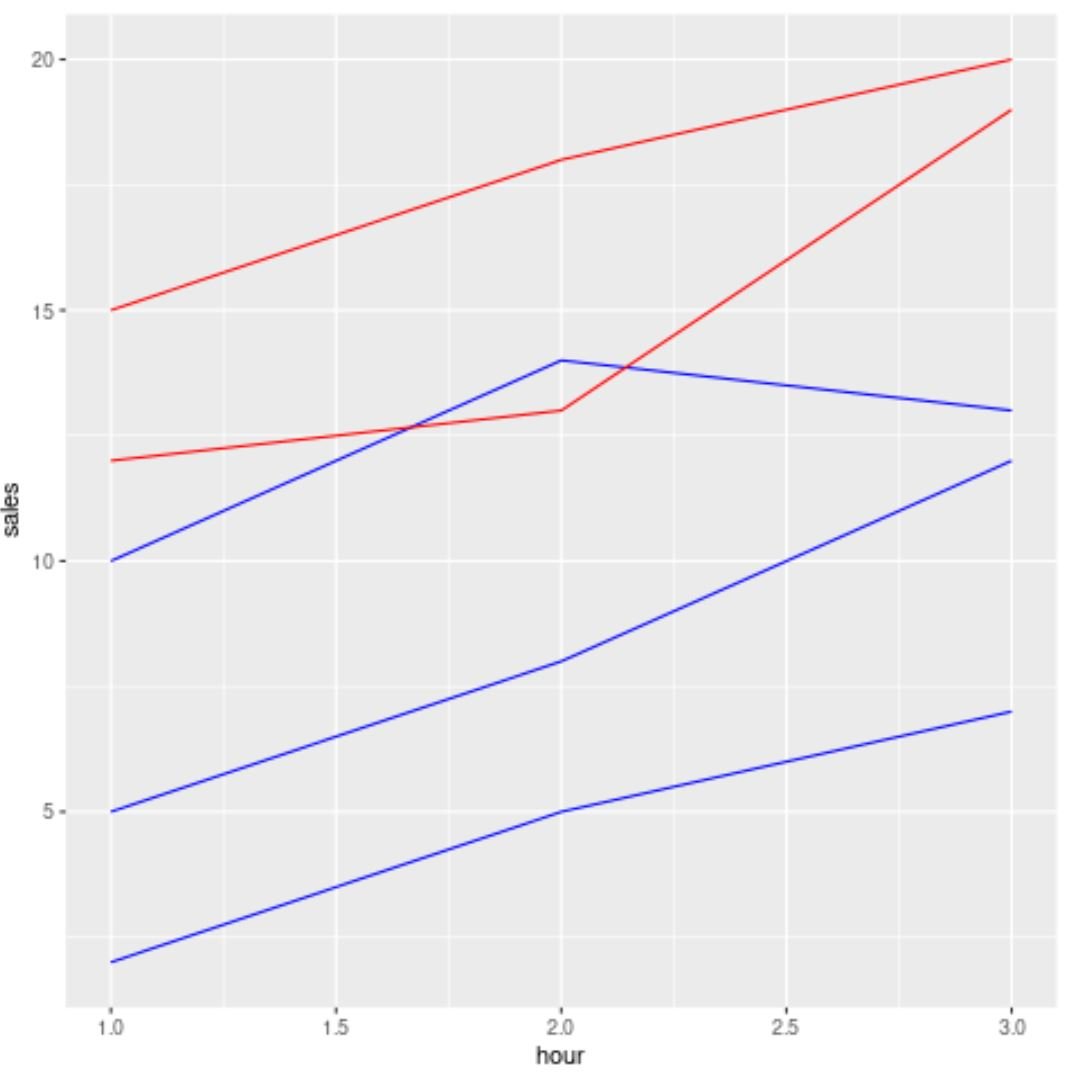
Notice that we’re able to create the line chart successfully without any error this time.
Additional Resources
The following tutorials explain how to troubleshoot other common errors in R:
How to Fix in R: Error in as.Date.numeric(x) : ‘origin’ must be supplied
How to Fix: Error in stripchart.default(x1, …) : invalid plotting method
How to Fix: Error in eval(predvars, data, env) : object ‘x’ not found