You can quickly generate a normal distribution in Python by using the numpy.random.normal() function, which uses the following syntax:
numpy.random.normal(loc=0.0, scale=1.0, size=None)
where:
- loc: Mean of the distribution. Default is 0.
- scale: Standard deviation of the distribution. Default is 1.
- size: Sample size.
This tutorial shows an example of how to use this function to generate a normal distribution in Python.
Related: How to Make a Bell Curve in Python
Example: Generate a Normal Distribution in Python
The following code shows how to generate a normal distribution in Python:
from numpy.random import seed
from numpy.random import normal

#make this example reproducible
seed(1)

#generate sample of 200 values that follow a normal distribution
data = normal(loc=0, scale=1, size=200)

#view first six values
data[0:5]

array([ 1.62434536, -0.61175641, -0.52817175, -1.07296862,  0.86540763])
We can quickly find the mean and standard deviation of this distribution:
import numpy as np

#find mean of sample
np.mean(data)

0.1066888148479486

#find standard deviation of sample
np.std(data, ddof=1)

0.9123296653173484
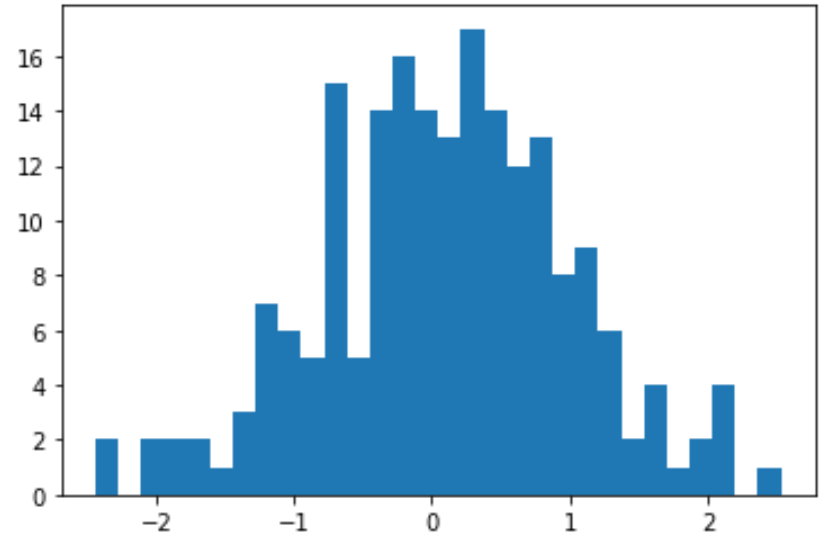
We can also create a quick histogram to visualize the distribution of data values:
import matplotlib.pyplot as plt
count, bins, ignored = plt.hist(data, 30)
plt.show()
We can even perform a Shapiro-Wilk test to see if the dataset comes from a normal population:
from scipy.stats import shapiro

#perform Shapiro-Wilk test
shapiro(data)

ShapiroResult(statistic=0.9958659410, pvalue=0.8669294714)
The p-value of the test turns out to be 0.8669. Since this value is not less than .05, we can assume the sample data comes from a population that is normally distributed.
This result shouldn’t be surprising since we generated the data using the numpy.random.normal() function, which generates a random sample of data that comes from a normal distribution.


