A five number summary is a way to summarize a dataset using the following five values:
- The minimum
- The first quartile
- The median
- The third quartile
- The maximum
By simply knowing these five values, we can know a great deal about a dataset.
The following step-by-step example shows how to find the five number summary for the following dataset on a TI-84 calculator:
Dataset: 4, 6, 6, 7, 8, 12, 15, 17, 20, 21, 21, 23, 24, 27, 28
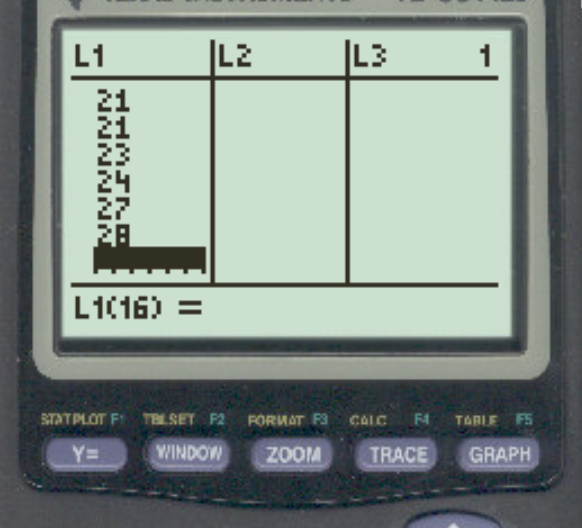
Step 1: Enter the Data
First, we will input the data values. Press Stat, then press EDIT. Then enter the values of the dataset in column L1:
Step 2: Find the Five Number Summary
Next, press Stat and then scroll over to the right and press CALC. Then press 1-Var Stats.

In the new screen that appears, simply press Enter.

Once you press Enter, a list of summary statistics will appear. Scroll down to the very bottom of the list:

From this screen we can observe the five number summary:
- The minimum: 4
- The first quartile (Q1): 7
- The median: 17
- The third quartile (Q3): 23
- The maximum: 28
These five numbers summarize the distribution of values in our original dataset.
We can also use these numbers to find the following metrics:
- Range: Maximum – Minimum = 28 – 4 = 4
- Interquartile Range: Q3 – Q1 = 23 – 7 = 16
These two metrics give us an idea of how spread out the values are in the dataset.
Additional Resources
How to Perform a One Sample t-test on a TI-84 Calculator
How to Perform a Two Sample t-test on a TI-84 Calculator
How to Calculate Confidence Intervals on a TI-84 Calculator