A five number summary is a way to summarize a dataset using the following five values:
- The minimum
- The first quartile
- The median
- The third quartile
- The maximum
The five number summary is useful because it provides a concise summary of the distribution of the data in the following ways:
- It tells us where the middle value is located, using the median.
- It tells us how spread out the data is, using the first and third quartiles.
- It tells us the range of the data, using the minimum and the maximum.
By simply knowing these five values, we can know a great deal about a dataset.
How to Find a Five Number Summary in Google Sheets
We can use the following steps to find the five number summary of a dataset in Google Sheets:
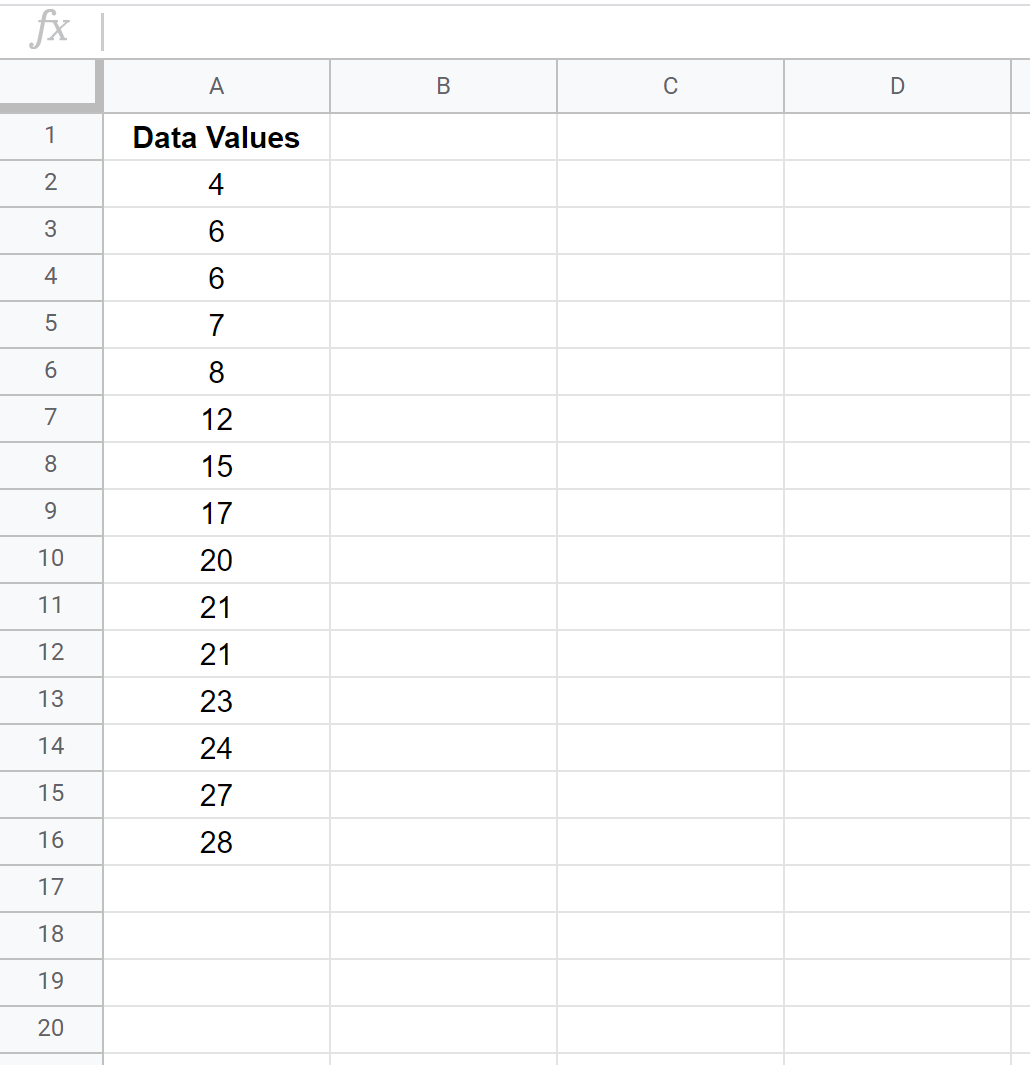
Step 1: Enter all data values in one column.
First, enter the values of the dataset in one column:
Step 2: Calculate the five number summary.
The five values of the five number summary are shown in column D and the formulas used to find these values are shown in column E:
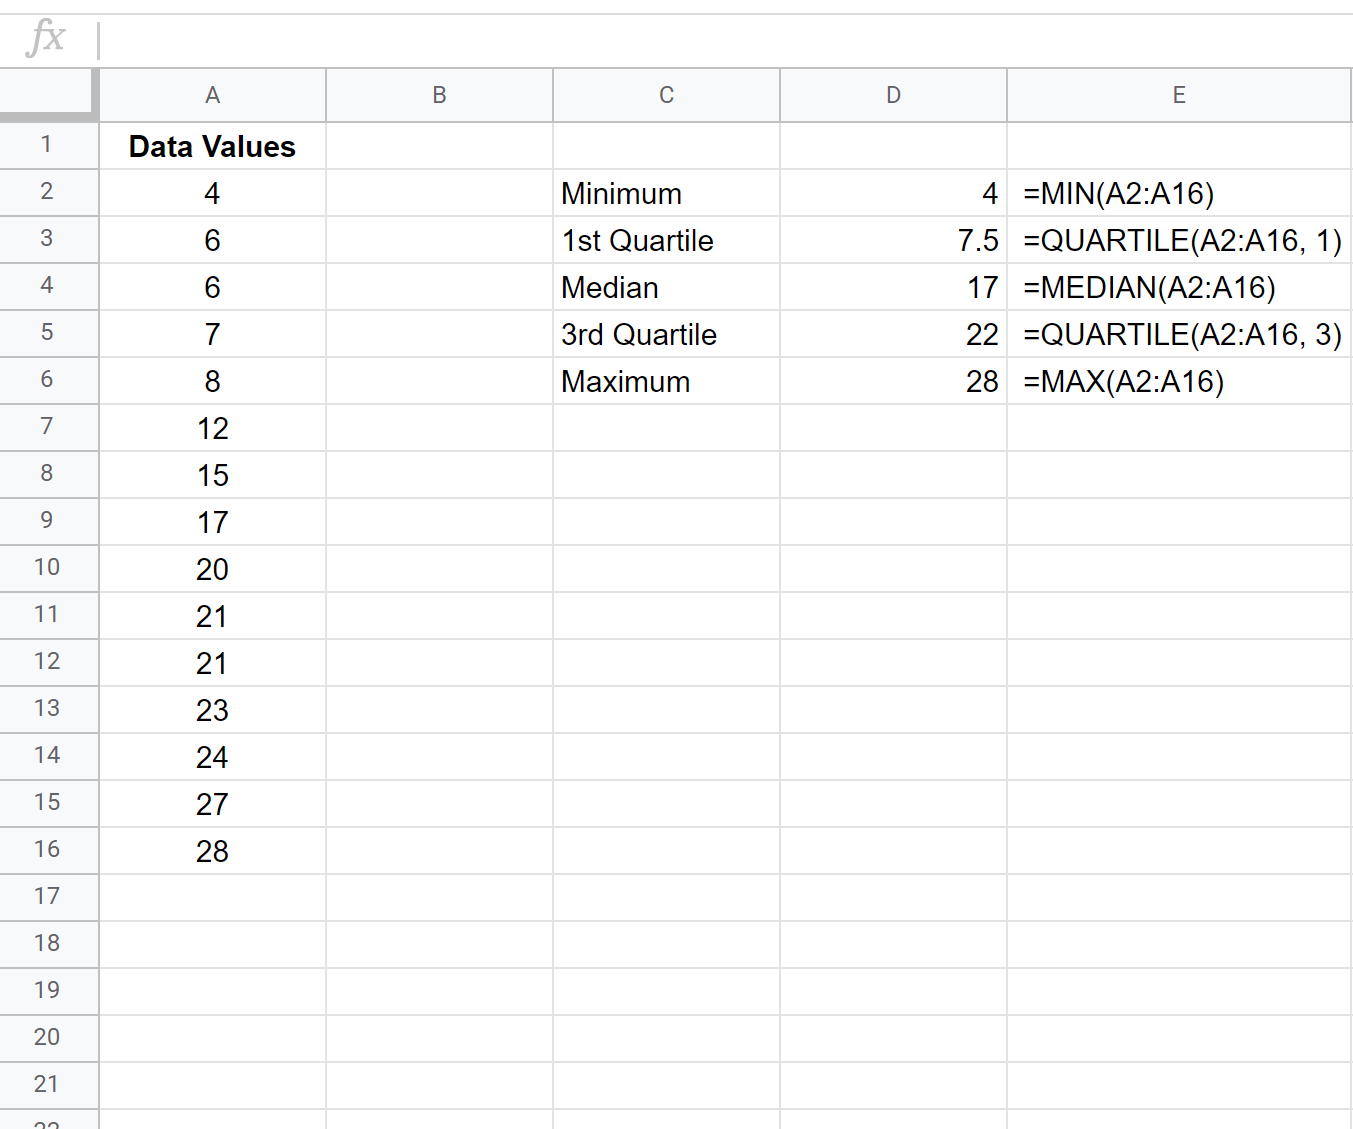
Thus, the five number summary of this dataset is:
- Minimum: 4
- 1st Quartile: 7.5
- Median: 17
- 3rd Quartile: 22
- Maximum: 28
From these five numbers we can get a good idea of where the center of the dataset is located, how spread out the values are, and the range of values.
Technical Note:
There are two quartile functions in Google Sheets:
QUARTILE.INC() – Calculates percentiles using “greater than or equal to” in an “inclusive” manner.
QUARTILE.EXC() – Calculates percentiles using “greater than” in an “exclusive” manner.
The default function QUARTILE() uses the QUARTILE.INC() method.
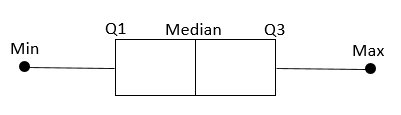
Visualize a Five Number Summary
One of the easiest ways to visualize a five number summary is by creating a boxplot, which uses a box with a line in the middle along with “whiskers” that extend on each end to represent the minimum and maximum values.
Feel free to use the Statology Boxplot Generator to automatically create a boxplot for a given dataset.
You can also follow this tutorial to find out how to create a boxplot in Google Sheets for a given dataset.