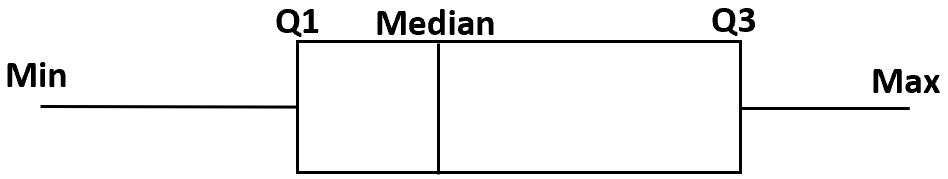
A box plot is a type of plot that displays the five number summary of a dataset, which includes:
- The minimum value
- The first quartile (the 25th percentile)
- The median value
- The third quartile (the 75th percentile)
- The maximum value
To make a box plot, we draw a box from the first to the third quartile. Then we draw a vertical line at the median. Lastly, we draw “whiskers” from the quartiles to the minimum and maximum value.
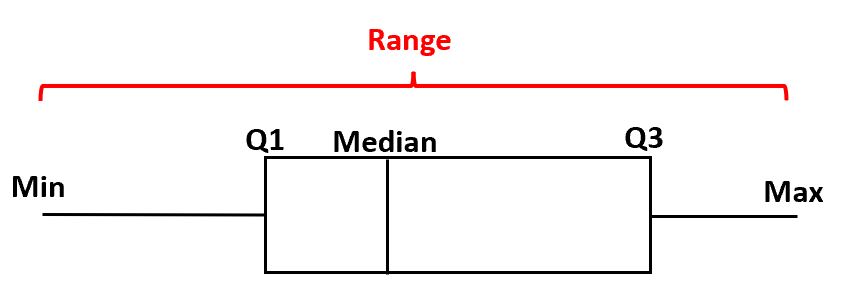
The range of a box plot is the difference between the maximum and minimum value.
- Range = Maximum – Minimum
To find the range of a given box plot, we can simply subtract the value located at the lower whisker from the value located at the upper whisker.
The following examples show how to find the range of a box plot in practice.
Example 1: Exam Scores
The following box plot shows the distribution of scores on a certain college exam. What is the range of the exam scores?
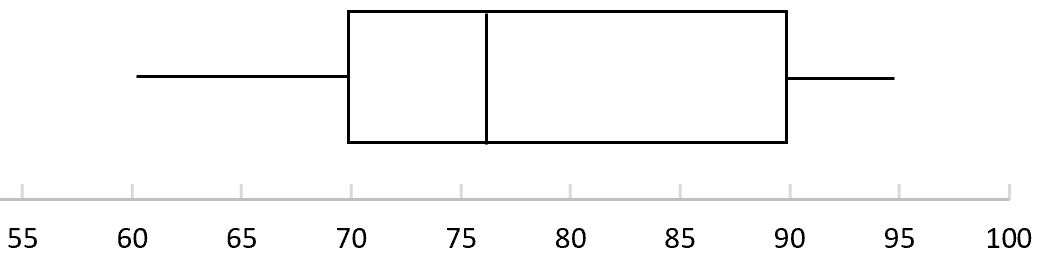
We can find the following values on the box plot to answer this:
- Range = Maximum – Minimum
- Range = 95 – 60
- Range = 35
The range of the exam scores is 35.
Example 2: Points Scored
The following box plot shows the distribution of points scored by basketball players in a certain league. What is the range of the distribution?
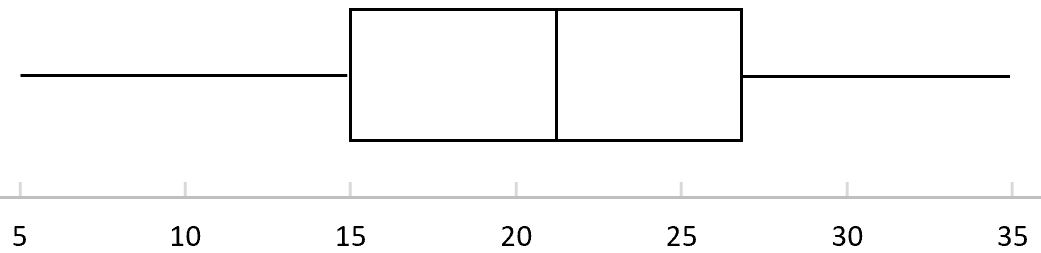
We can find the following values on the box plot to answer this:
- Range = Maximum – Minimum
- Range = 35 – 5
- Range = 30
The range of the distribution is 30.
Example 3: Comparing Plant Heights
The following box plots show the distribution of heights for two different plant species: Red and Blue. Which distribution has a larger range?
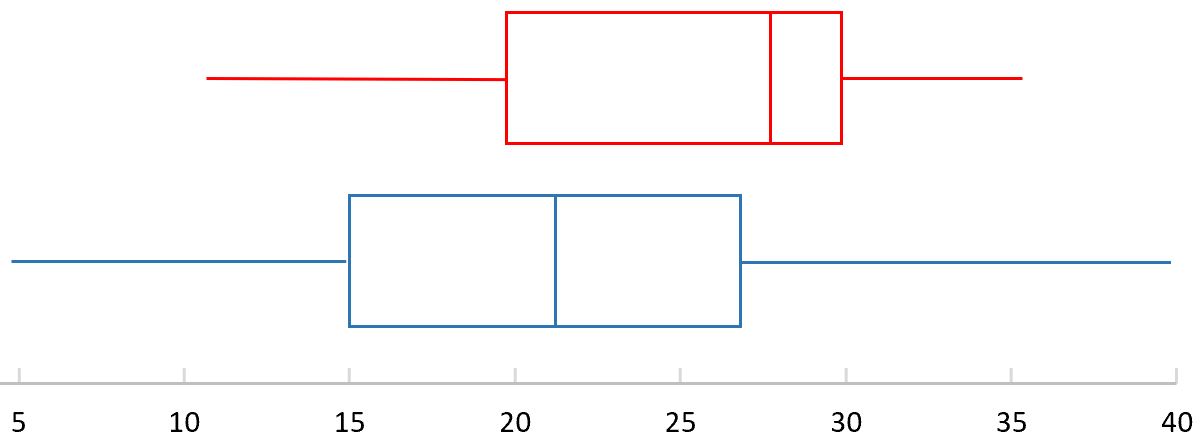
First, let’s find the range of the red box plot:
- Range = Maximum – Minimum
- Range = 35 – 10
- Range = 25
Next, let’s find the range of the blue box plot:
- Range = Maximum – Minimum
- Range = 40 – 5
- Range = 35
The range for the Blue species is larger.
Additional Resources
The following tutorials provide additional information about box plots:
Box Plot Generator
How to Compare Box Plots
How to Identify Skewness in Box Plots
How to Find the Interquartile Range of a Box Plot