Exponential regression is a type of regression model that can be used to model the following situations:
1. Exponential growth: Growth begins slowly and then accelerates rapidly without bound.
2. Exponential decay: Decay begins rapidly and then slows down to get closer and closer to zero.
The equation of an exponential regression model takes the following form:
y = abx
where:
- y: The response variable
- x: The predictor variable
- a, b: The regression coefficients that describe the relationship between x and y
The following step-by-step example shows how to perform exponential regression in Excel.
Step 1: Create the Data
First, let’s create a fake dataset that contains 20 observations:
Step 2: Take the Natural Log of the Response Variable
Next, we need to create a new column that represents the natural log of the response variable y:
Step 3: Fit the Exponential Regression Model
Next, we’ll fit the exponential regression model. To do so, click the Data tab along the top ribbon, then click Data Analysis within the Analysis group.
If you don’t see Data Analysis as an option, you need to first load the Analysis ToolPak.
In the window that pops up, click Regression. In the new window that pops up, fill in the following information:
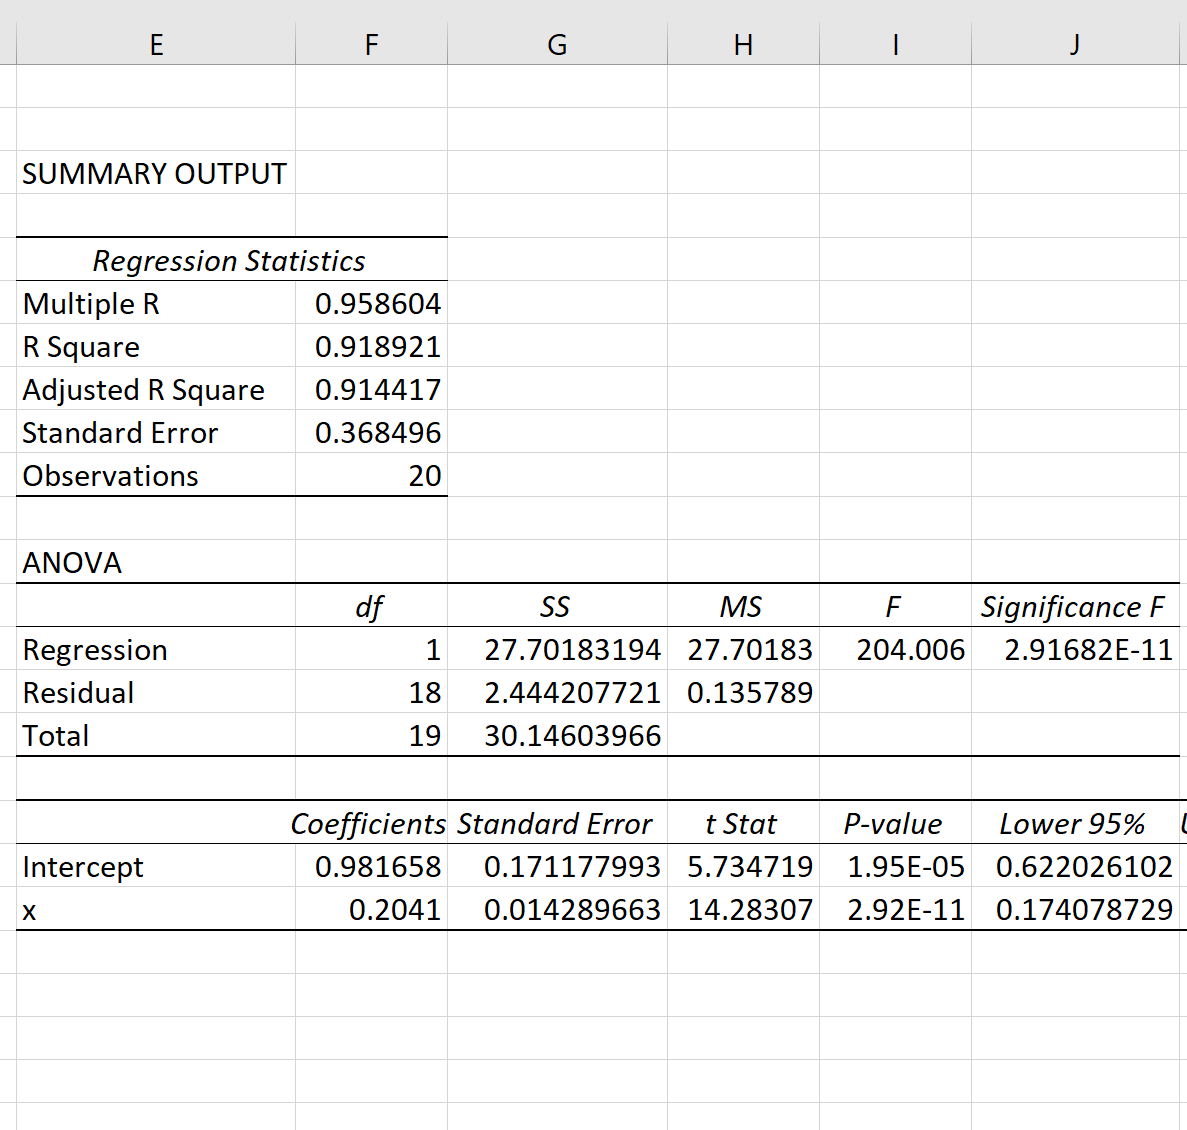
Once you click OK, the output of the exponential regression model will be shown:
The overall F-value of the model is 204.006 and the corresponding p-value is extremely small, which indicates that the model as a whole is useful.
Using the coefficients from the output table, we can see that the fitted exponential regression equation is:
ln(y) = 0.9817 + 0.2041(x)
Applying e to both sides, we can rewrite the equation as:
y = 2.6689 * 1.2264x
We can use this equation to predict the response variable, y, based on the value of the predictor variable, x. For example, if x = 14, then we would predict that y would be 46.47:
y = 2.6689 * 1.226414 = 46.47
Bonus: Feel free to use this online Exponential Regression Calculator to automatically compute the exponential regression equation for a given predictor and response variable.
Additional Resources
How to Perform Simple Linear Regression in Excel
How to Perform Multiple Linear Regression in Excel
How to Perform Quadratic Regression in Excel
How to Perform Polynomial Regression in Excel


