The following example shows how to calculate the difference between two pivot tables in Excel.
Example: Calculate Difference Between Two Pivot Tables
Suppose we have the following two pivot tables that show the total sales and returns for different stores during two different years:

Suppose we would like to calculate the difference in the Sum of Sales and Sum of Returns columns between the two pivot tables.
To calculate the difference in the Sum of Sales columns between the two pivot tables for just store A, we can type the following formula:
=GETPIVOTDATA("Sum of Sales",$E$2,"Team","A")-GETPIVOTDATA("Sum of Sales",$E$10,"Team","A")
The following screenshot shows how to use this formula in practice:
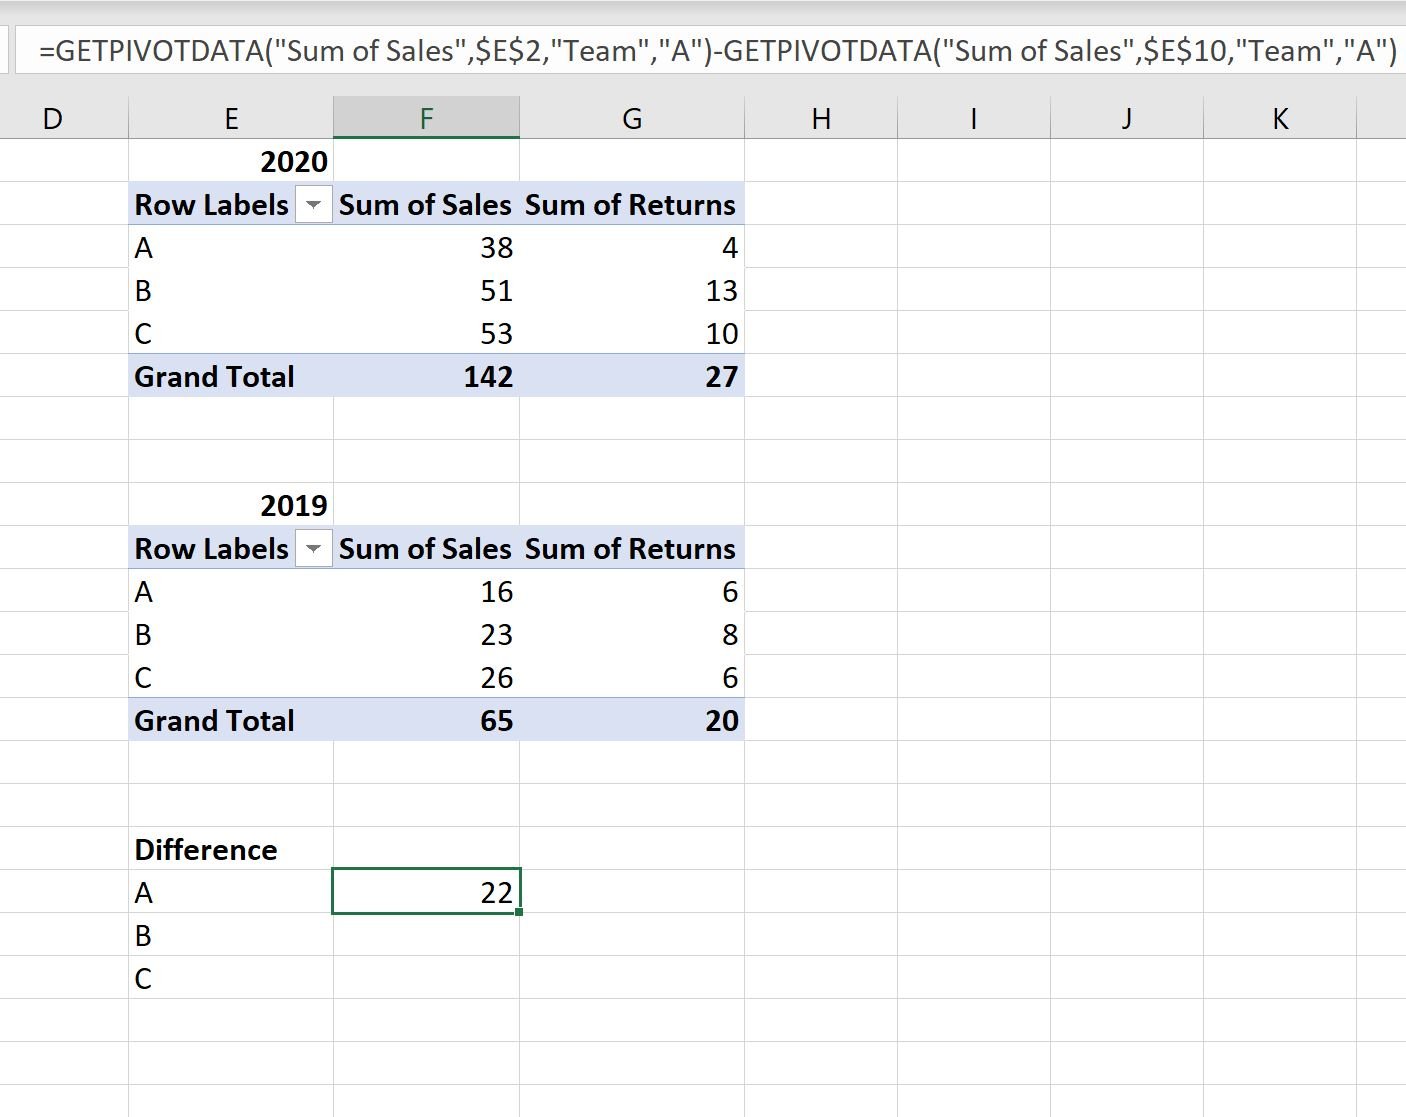
Notice that this formula correctly calculates the difference between the Sum of Sales values between 2020 and 2019 for store A.
Difference = 38 – 16 = 22.
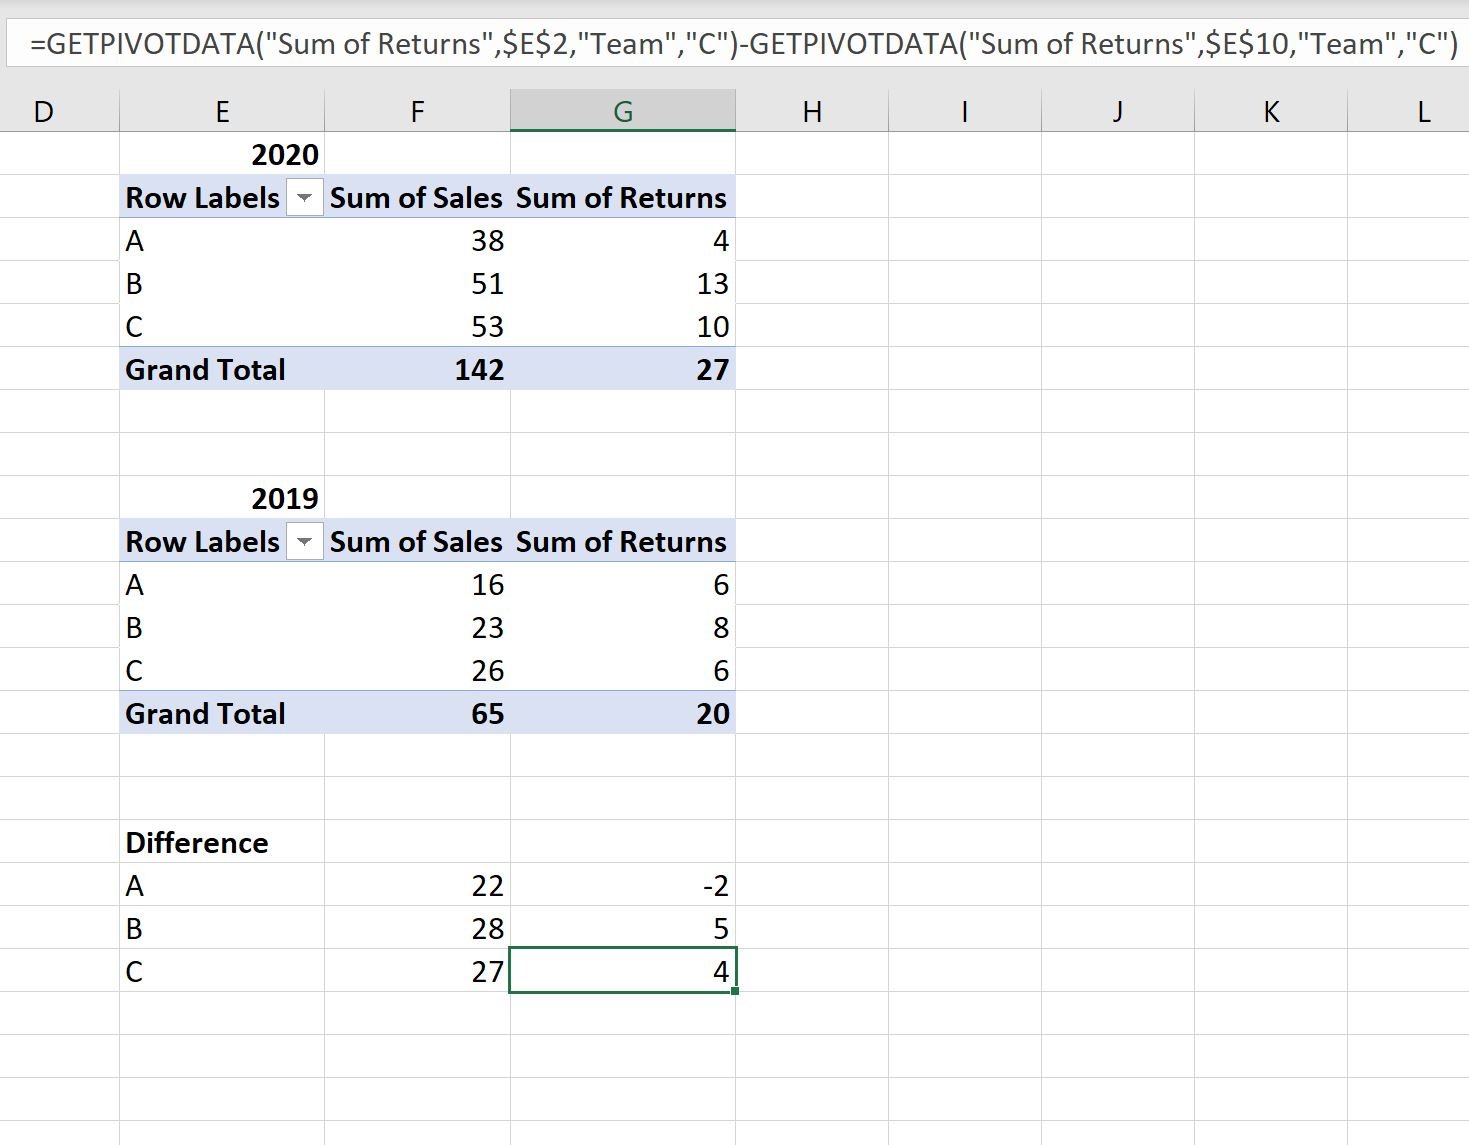
We can change the values in the GETPIVOTDATA formula to calculate the difference between each corresponding value in the two pivot tables:
Note: You can find the complete documentation for the GETPIVOTDATA function in Excel here.
Additional Resources
The following tutorials explain how to perform other common tasks in Excel:
How to Create Tables in Excel
Excel: How to Group Values in Pivot Table by Range
How to Group by Month and Year in Pivot Table in Excel