The normal distribution is the most commonly-used probability distribution in all of statistics.

It has the following properties:
- Bell shaped
- Symmetrical
- Unimodal – it has one “peak”
- Mean and median are equal; both are located at the center of the distribution
- About 68% of data falls within one standard deviation of the mean
- About 95% of data falls within two standard deviations of the mean
- About 99.7% of data falls within three standard deviations of the mean
This tutorial shares 6 examples of real-world phenomena that actually follow the normal distribution.
Example 1: Birthweight of Babies
It’s well-documented that the birthweight of newborn babies is normally distributed with a mean of about 7.5 pounds.
The histogram of the birthweight of newborn babies in the U.S. displays a bell-shape that is typically of the normal distribution:

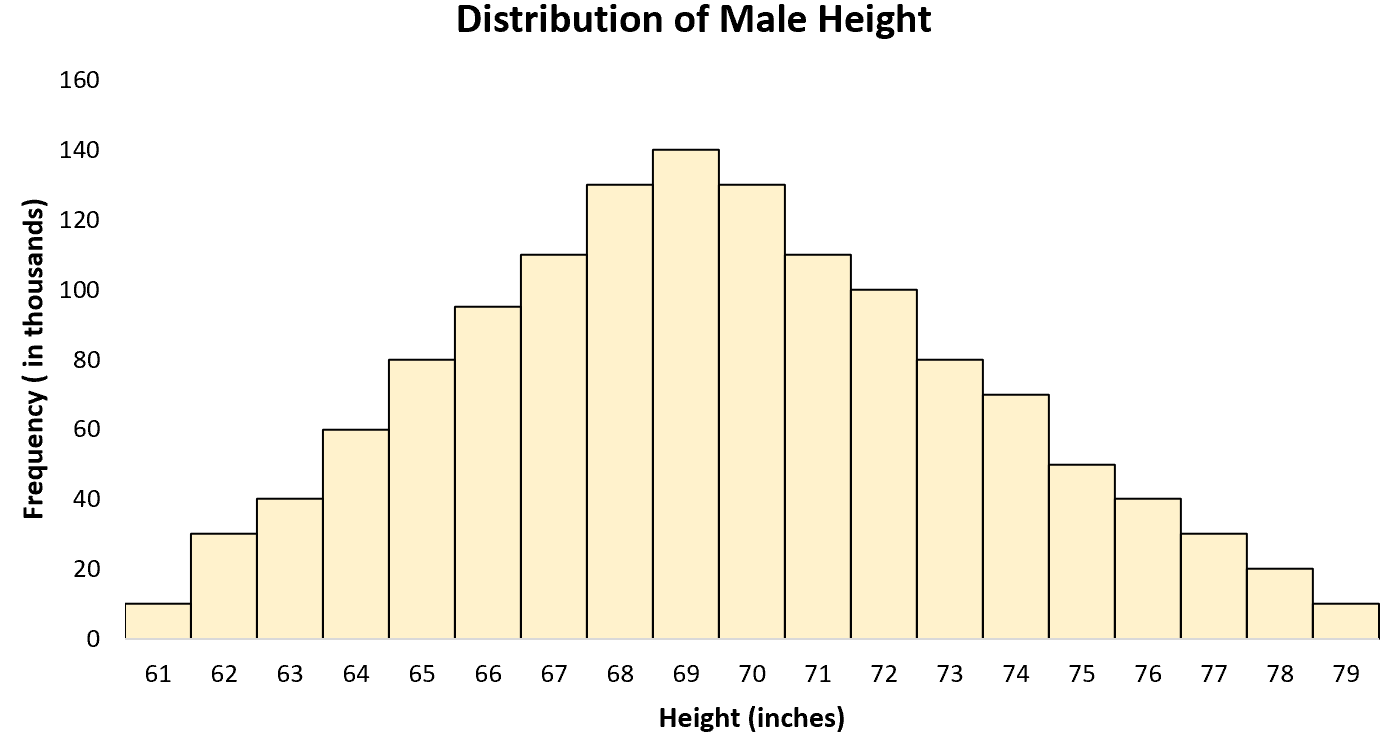
Example 2: Height of Males
The distribution of the height of males in the U.S. is roughly normally distributed with a mean of 70 inches and a standard deviation of 3 inches.
A histogram of the height of all U.S. male reveals a bell shape:
Example 3: Shoe Sizes
The distribution of shoe sizes for males in the U.S. is roughly normally distributed with a mean of size 10 and a standard deviation of 1.
A histogram of the shoe sizes of all U.S. male reveals a bell shape with a single peak at size 10:

Example 4: ACT Scores
The distribution of ACT scores for high school students in the U.S. is normally distributed with a mean of 21 and a standard deviation of about 5.
A histogram of the ACT scores for all U.S. high school students illustrates this normal distribution:

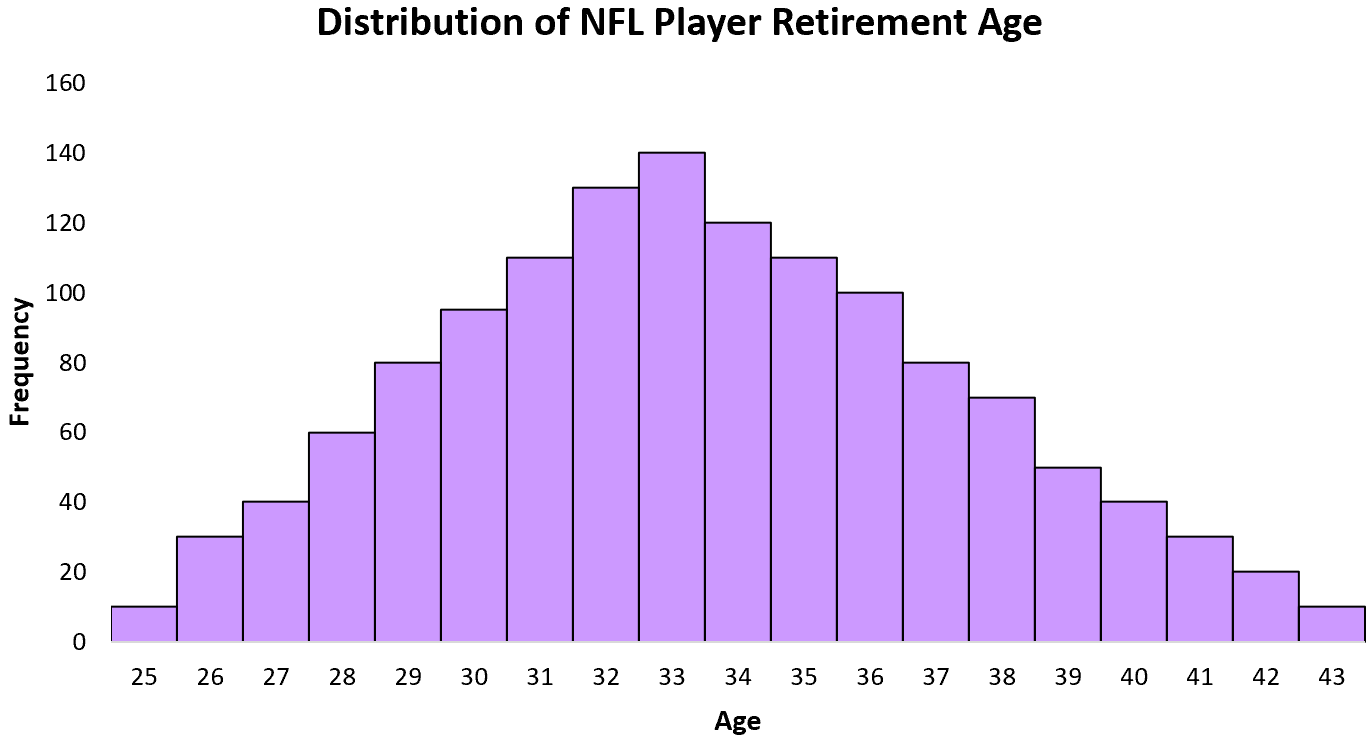
Example 5: Average NFL Player Retirement Age
The distribution of retirement age for NFL players is normally distributed with a mean of 33 years old and a standard deviation of about 2 years.
A histogram of this distribution exhibits a classical bell shape:
Example 6: Blood Pressure
The distribution of diastolic blood pressure for men is normally distributed with a mean of about 80 and a standard deviation of 20.
A histogram of the distribution of blood pressures for all mean displays a normal distribution with a bell shape:

Additional Resources
The following tutorials share examples of other probability distributions in real life:
5 Real-Life Examples of the Poisson Distribution
5 Real-Life Examples of the Binomial Distribution
5 Real-Life Examples of the Geometric Distribution
5 Real-Life Examples of the Uniform Distribution