One of the key assumptions in linear regression is that there is no correlation between the residuals, e.g. the residuals are independent.
One way to determine if this assumption is met is to perform a Durbin-Watson test, which is used to detect the presence of autocorrelation in the residuals of a regression. This test uses the following hypotheses:
H0 (null hypothesis): There is no correlation among the residuals.
HA (alternative hypothesis): The residuals are autocorrelated.
This tutorial provides a step-by-step example of how to perform a Durbin-Watson test in Excel.
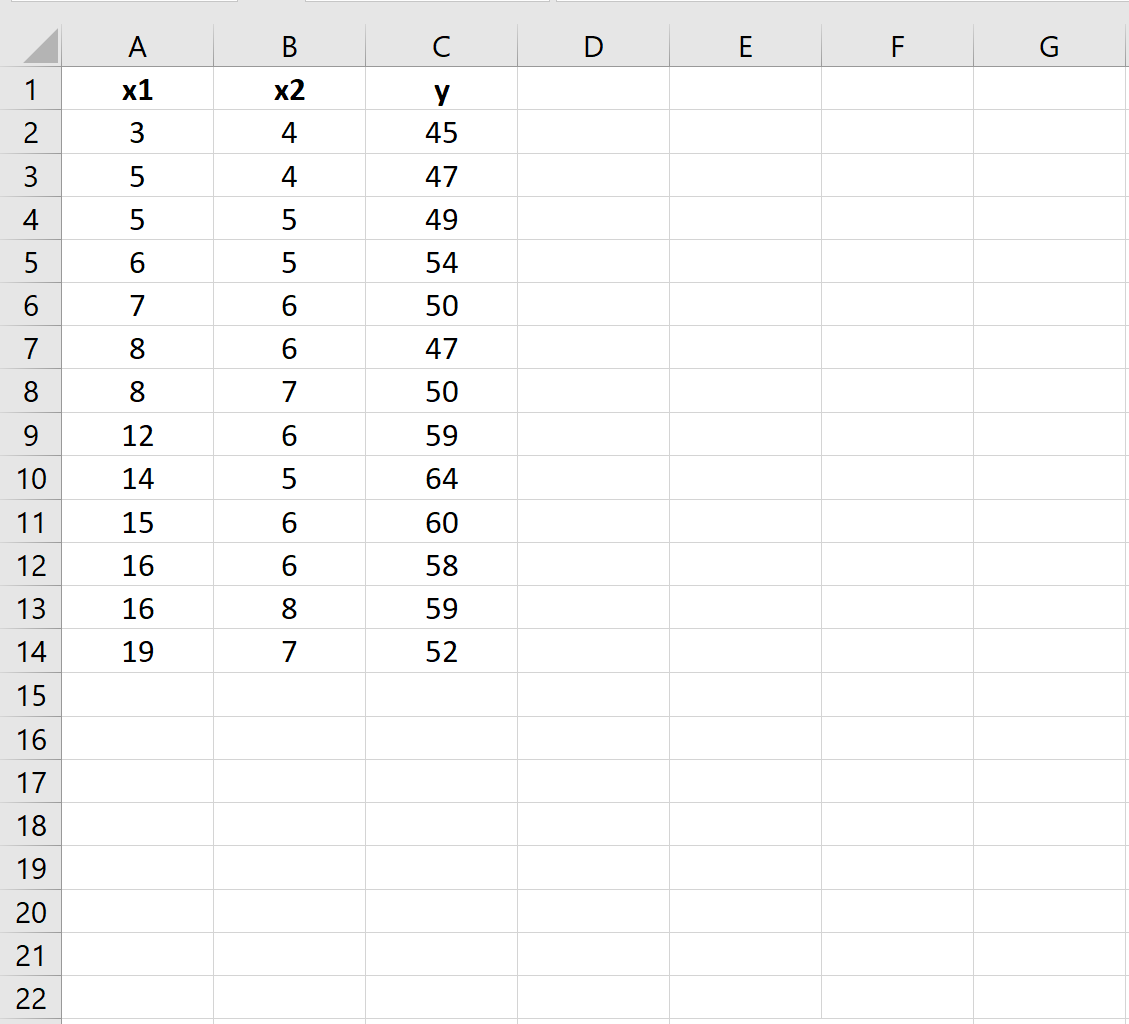
Step 1: Enter the Data
First, we’ll enter the values for a dataset that we’d like to build a multiple linear regression model:
Step 2: Fit a Multiple Linear Regression Model
Next, we’ll fit a multiple linear regression model using y as the response variable and x1 and x2 as predictor variables.
To do so, click the Data tab along the top ribbon. Then click Data Analysis within the Analyze group.

If you don’t see this as an option, you need to first load the Analysis ToolPak.
In the window that appears, click Regression and then click OK. In the new window that appears, fill in the following information:
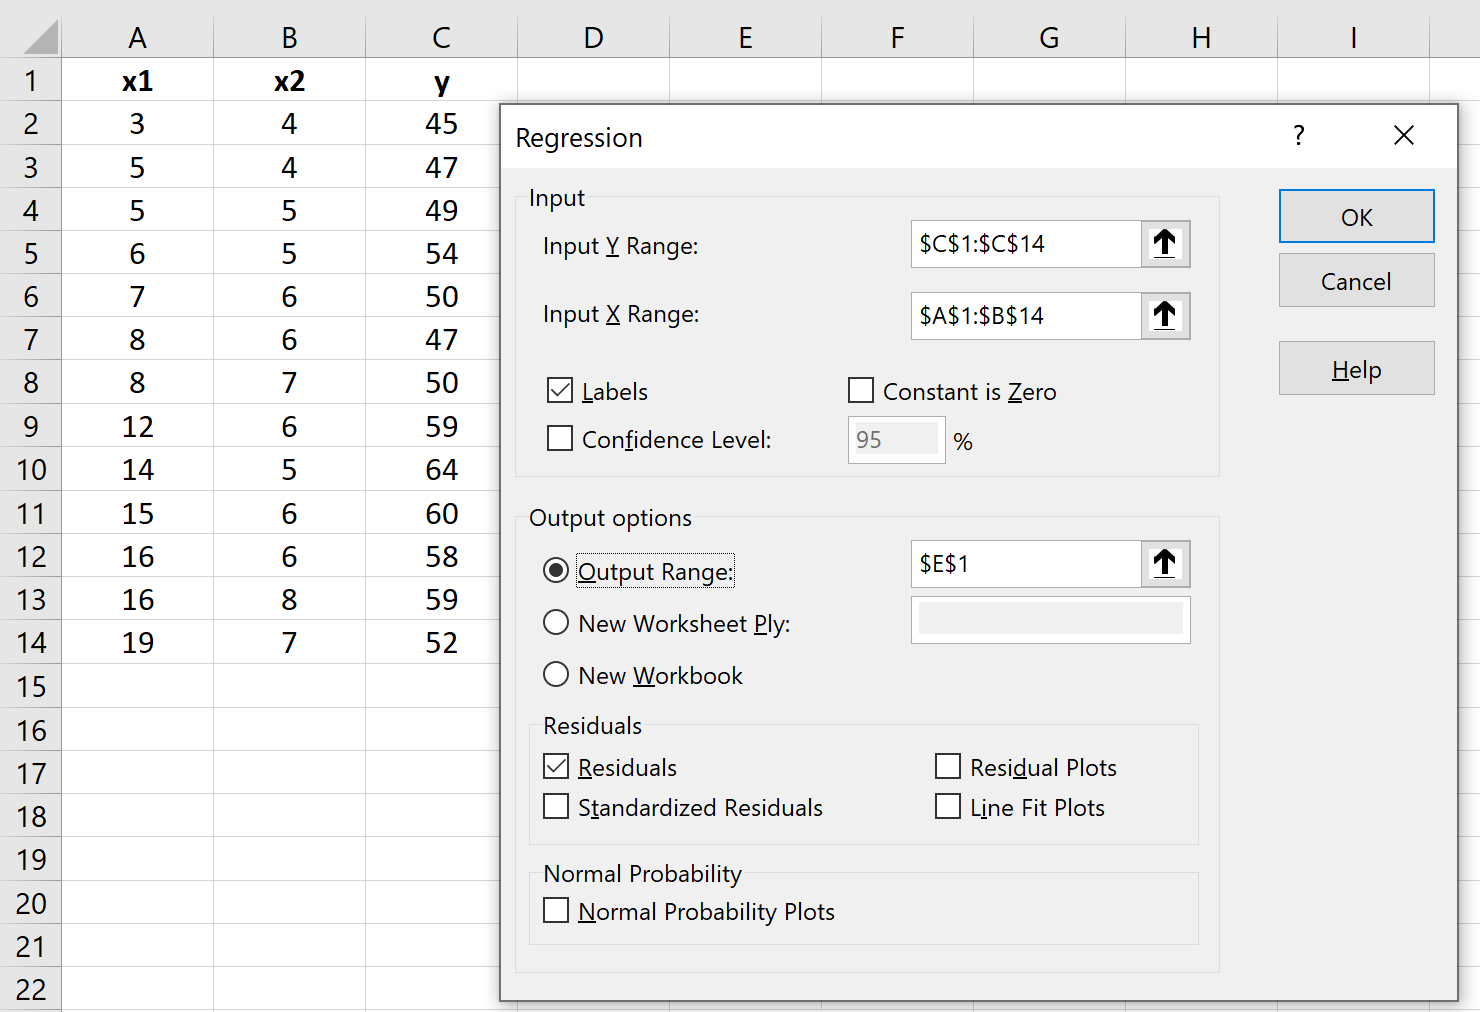
Once you click OK, the regression output will appear:

Step 3: Perform the Durbin-Watson Test
The test statistic for the Durbin-Watson test, denoted d, is calculated as follows:
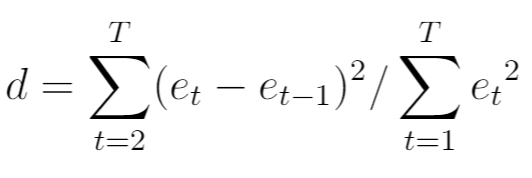
where:
- T: The total number of observations
- et: The tth residual from the regression model
To calculate this test statistic in Excel, we can use the following formula:
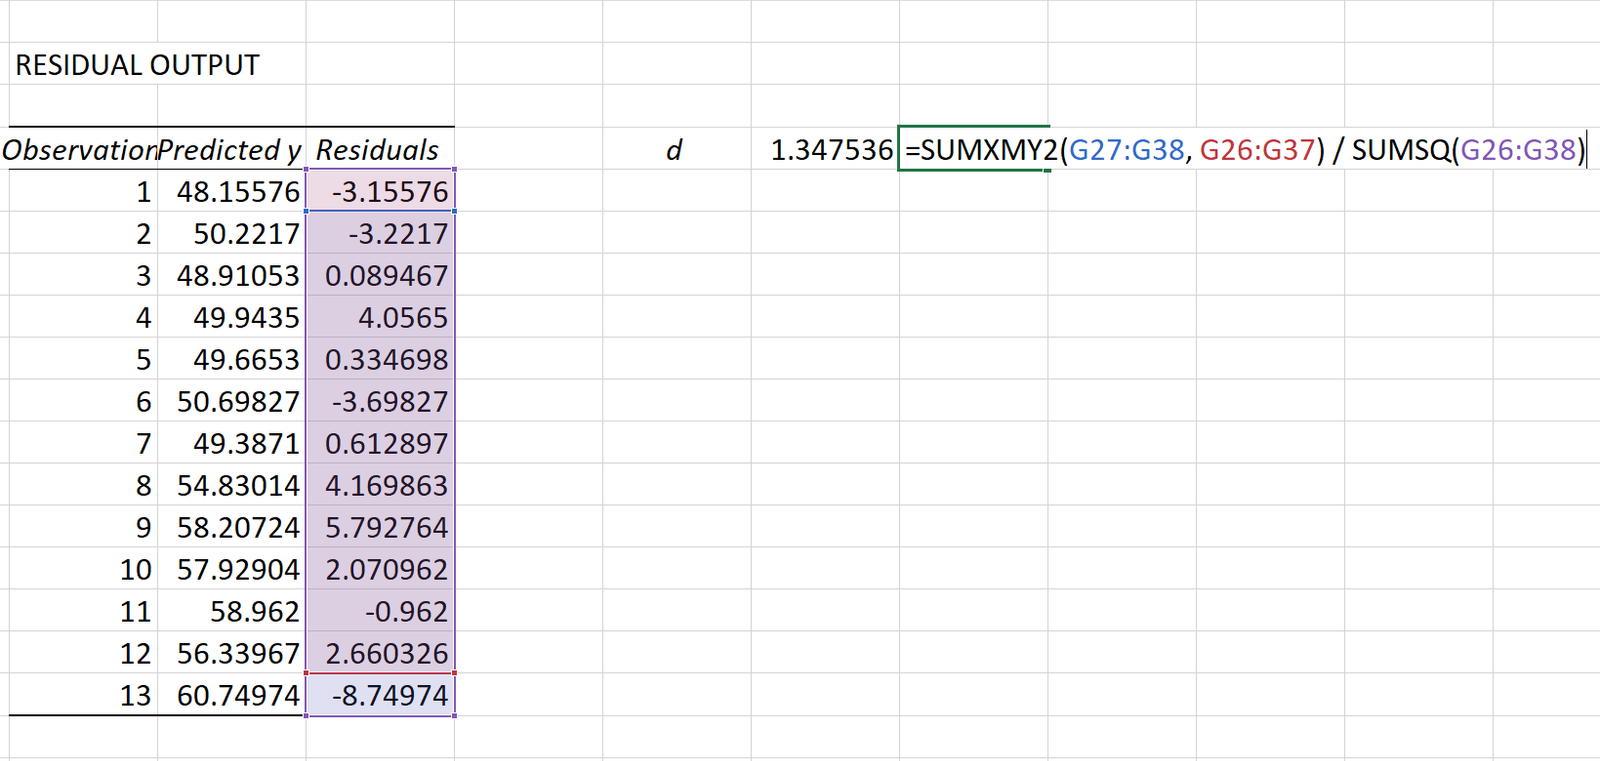
The test statistic turns out to be 1.3475.
To determine if a Durbin-Watson test statistic is significantly significant at a certain alpha level, we can refer to this table of critical values.
For α = .05, n = 13 observations, and k = 2 independent variables in the regression model, the Durbin-Watson table shows the following upper and lower critical values:
- Lower critical value: 0.86
- Upper critical value: 1.56
Since our test statistic of 1.3475 does not lie outside of this range, we do not have sufficient evidence to reject the null hypothesis of the Durbin-Watson test.
In other words, there is no correlation among the residuals.
What to Do if Autocorrelation is Detected
If you reject the null hypothesis and conclude that autocorrelation is present in the residuals, then you have a few different options to correct this problem if it’s serious enough:
- For positive serial correlation, consider adding lags of the dependent and/or independent variable to the model.
- For negative serial correlation, check to make sure that none of your variables are overdifferenced.
- For seasonal correlation, consider adding seasonal dummy variables to the model.
Additional Resources
How to Create a Residual Plot in Excel
How to Calculate Standardized Residuals in Excel
How to Calculate Residual Sum of Squares in Excel