Linear regression is a method we can use to quantify the relationship between one or more predictor variables and a response variable.
Typically we use linear regression with quantitative variables. Sometimes referred to as “numeric” variables, these are variables that represent a measurable quantity. Examples include:
- Number of square feet in a house
- Population size of a city
- Age of an individual
However, sometimes we wish to use categorical variables as predictor variables. These are variables that take on names or labels and can fit into categories. Examples include:
- Eye color (e.g. “blue”, “green”, “brown”)
- Gender (e.g. “male”, “female”)
- Marital status (e.g. “married”, “single”, “divorced”)
When using categorical variables, it doesn’t make sense to just assign values like 1, 2, 3, to values like “blue”, “green”, and “brown” because it doesn’t make sense to say that green is twice as colorful as blue or that brown is three times as colorful as blue.
Instead, the solution is to use dummy variables. These are variables that we create specifically for regression analysis that take on one of two values: zero or one.
Dummy Variables: Numeric variables used in regression analysis to represent categorical data that can only take on one of two values: zero or one.
The number of dummy variables we must create is equal to k-1 where k is the number of different values that the categorical variable can take on.
The following examples illustrate how to create dummy variables for different datasets.
Example 1: Create a Dummy Variable with Only Two Values
Suppose we have the following dataset and we would like to use gender and age to predict income:

To use gender as a predictor variable in a regression model, we must convert it into a dummy variable.
Since it is currently a categorical variable that can take on two different values (“Male” or “Female”), we only need to create k-1 = 2-1 = 1 dummy variable.
To create this dummy variable, we can choose one of the values (“Male” or “Female”) to represent 0 and the other to represent 1.
In general, we usually represent the most frequently occurring value with a 0, which would be “Male” in this dataset.
Thus, here’s how we would convert gender into a dummy variable:

We could then use Age and Gender_Dummy as predictor variables in a regression model.
Example 2: Create a Dummy Variable with Multiple Values
Suppose we have the following dataset and we would like to use marital status and age to predict income:

To use marital status as a predictor variable in a regression model, we must convert it into a dummy variable.
Since it is currently a categorical variable that can take on three different values (“Single”, “Married”, or “Divorced”), we need to create k-1 = 3-1 = 2 dummy variables.
To create this dummy variable, we can let “Single” be our baseline value since it occurs most often. Thus, here’s how we would convert marital status into dummy variables:
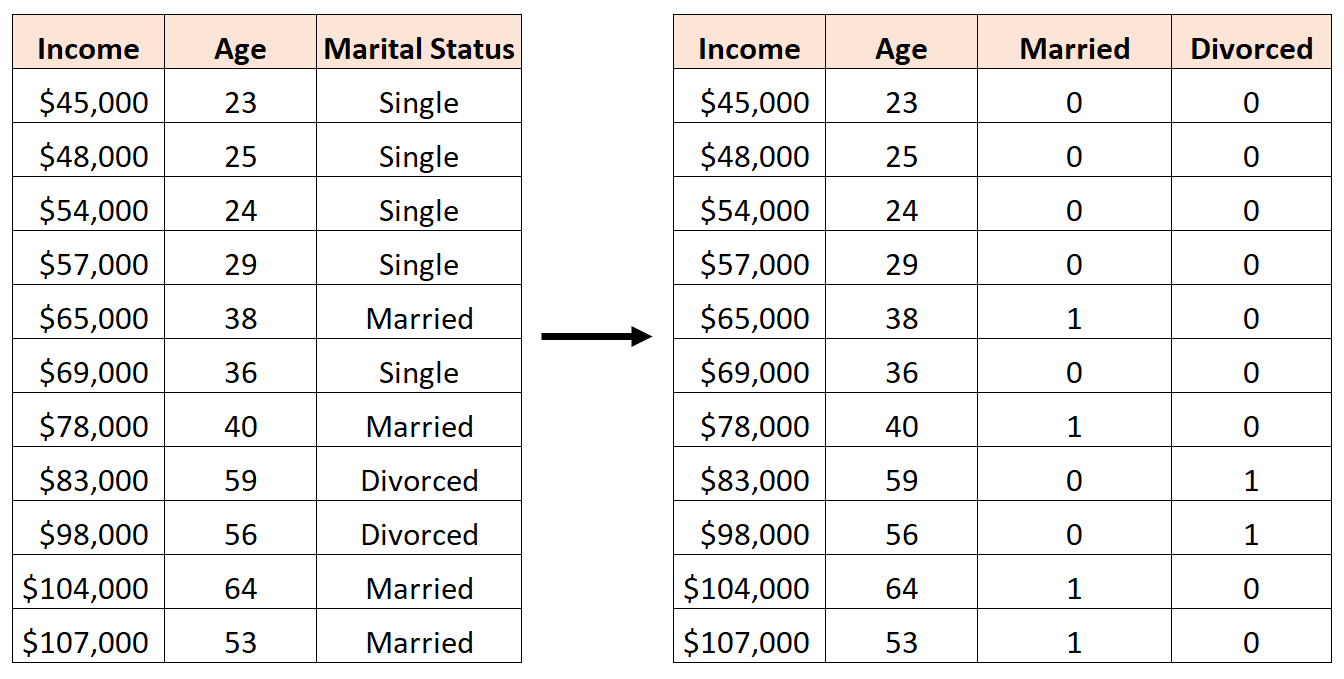
We could then use Age, Married, and Divorced as predictor variables in a regression model.
How to Interpret Regression Output with Dummy Variables
Suppose we fit a multiple linear regression model using the dataset in the previous example with Age, Married, and Divorced as the predictor variables and Income as the response variable.
Here’s the regression output:

The fitted regression line is defined as:
Income = 14,276.21 + 1,471.67*(Age) + 2,479.75*(Married) – 8,397.40*(Divorced)
We can use this equation to find the estimated income for an individual based on their age and marital status. For example, an individual who is 35 years old and married is estimated to have an income of $68,264:
Income = 14,276.21 + 1,471.67*(35) + 2,479.75*(1) – 8,397.40*(0) = $68,264
Here is how to interpret the regression coefficients from the table:
- Intercept: The intercept represents the average income for a single individual who is zero years old. Obviously you can’t be zero years old, so it doesn’t make sense to interpret the intercept by itself in this particular regression model.
- Age: Each one year increase in age is associated with an average increase of $1,471.67 in income. Since the p-value (.00) is less than .05, age is a statistically significant predictor of income.
- Married: A married individual, on average, earns $2,479.75 more than a single individual. Since the p-value (0.80) is not less than .05, this difference is not statistically significant.
- Divorced: A divorced individual, on average, earns $8,397.40 less than a single individual. Since the p-value (0.53) is not less than .05, this difference is not statistically significant.
Since both dummy variables were not statistically significant, we could drop marital status as a predictor from the model because it doesn’t appear to add any predictive value for income.
Additional Resources
Qualitative vs. Quantitative Variables
The Dummy Variable Trap
How to Read and Interpret a Regression Table
An Explanation of P-Values and Statistical Significance