Linear regression models are used to describe the relationship between one or more predictor variables and a response variable.
However, once we’ve fit a regression model it’s a good idea to also produce diagnostic plots to analyze the residuals of the model and make sure that a linear model is appropriate to use for the particular data we’re working with.
This tutorial explains how to create and interpret diagnostic plots for a given regression model in R.
Example: Create & Interpret Diagnostic Plots in R
Suppose we fit a simple linear regression model using ‘hours studied’ to predict ‘exam score’ for students in a certain class:
#create data frame
df frame(hours=c(1, 1, 2, 2, 2, 3, 3, 4, 4, 4, 4, 5, 5, 6),
                 score=c(67, 65, 68, 77, 73, 79, 81, 88, 80, 67, 84, 93, 90, 91))

#fit linear regression model
model = lm(score ~ hours, data=df)
We can use the plot() command to produce four diagnostic plots for this regression model:
#produce diagnostic plots for regression model
plot(model)
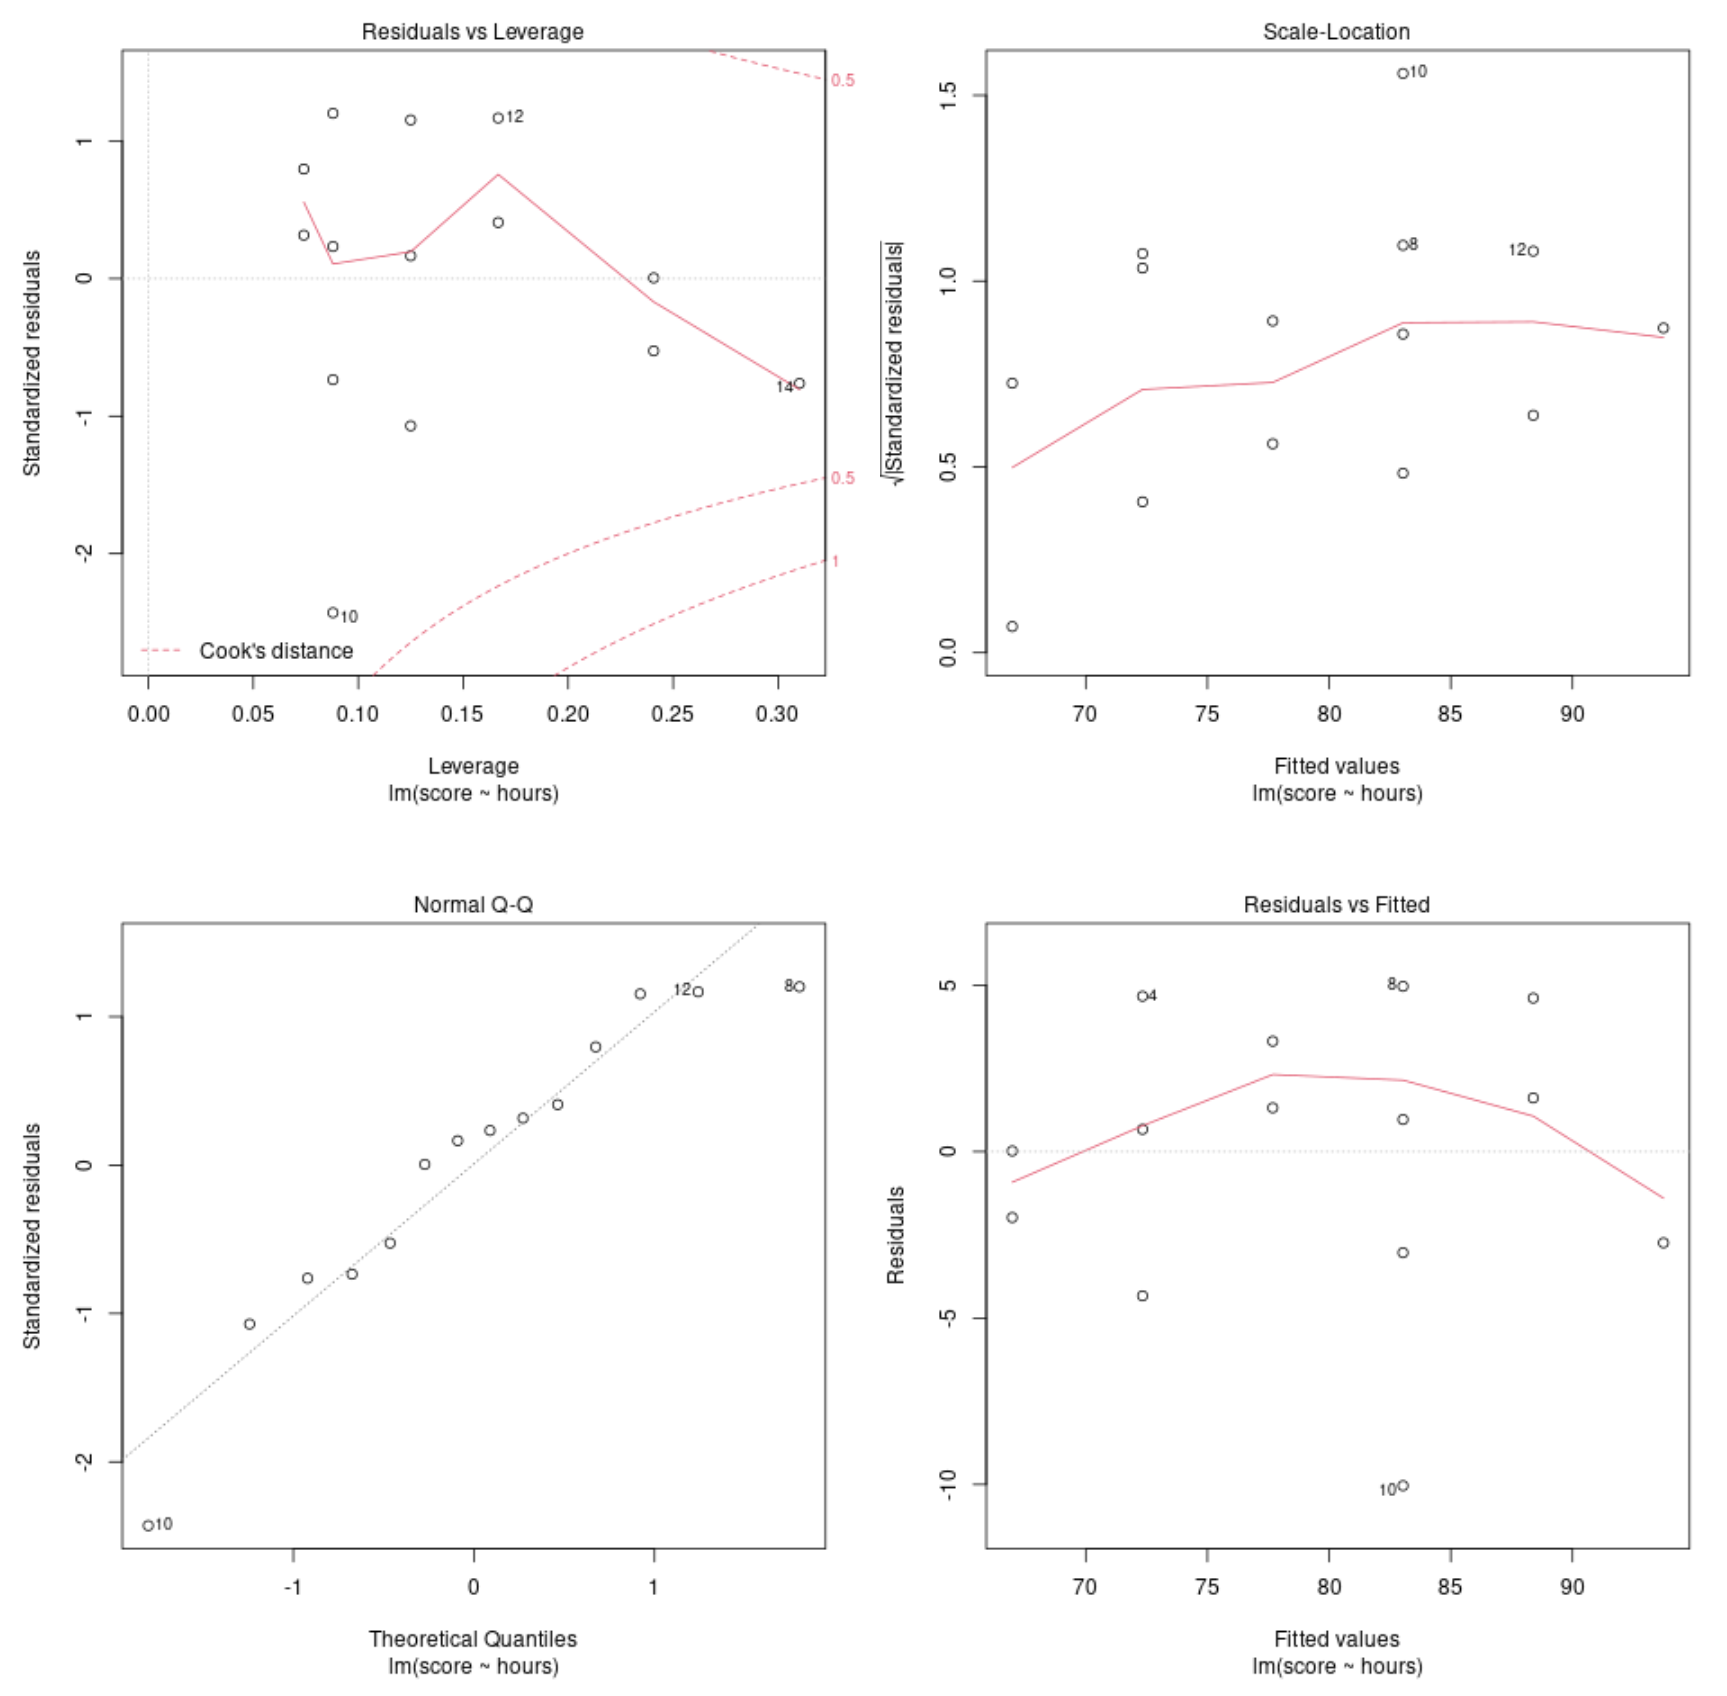
Diagnostic Plot #1: Residuals vs. Leverage Plot
This plot is used to identify influential observations. If any points in this plot fall outside of Cook’s distance (the dashed lines) then it is an influential observation.

In our example we can see that observation #10 lies closest to the border of Cook’s distance, but it doesn’t fall outside of the dashed line. This means there aren’t any overly influential points in our dataset.
Diagnostic Plot #2: Scale-Location Plot
This plot is used to check the assumption of equal variance (also called “homoscedasticity”) among the residuals in our regression model. If the red line is roughly horizontal across the plot, then the assumption of equal variance is likely met.

In our example we can see that the red line isn’t exactly horizontal across the plot, but it doesn’t deviate too wildly at any point. We would likely declare that the assumption of equal variance is not violated in this case.
Related: Understanding Heteroscedasticity in Regression Analysis
Diagnostic Plot #3: Normal Q-Q Plot
This plot is used to determine if the residuals of the regression model are normally distributed. If the points in this plot fall roughly along a straight diagonal line, then we can assume the residuals are normally distributed.

In our example we can see that the points fall roughly along the straight diagonal line. The observations #10 and #8 deviate a bit from the line at the tail ends, but not enough to declare that the residuals are non-normally distributed.
Diagnostic Plot #4: Residuals vs. Fitted Plot
This plot is used to determine if the residuals exhibit non-linear patterns. If the red line across the center of the plot is roughly horizontal then we can assume that the residuals follow a linear pattern.

In our example we can see that the red line deviates from a perfect horizontal line but not severely. We would likely declare that the residuals follow a roughly linear pattern and that a linear regression model is appropriate for this dataset.
Additional Resources
The Four Assumptions of Linear Regression
What Are Residuals in Statistics?
How to Create a Residual Plot in R
How to Interpret a Scale-Location Plot