Descriptive statistics are values that describe a dataset. They help us gain an understanding of where the center of the dataset is located along with how spread out the values are in the dataset.
The following example shows how to calculate the following descriptive statistics for a dataset in Google Sheets:
- Mean (the average value)
- Median (the middle value)
- Mode (the most frequently occurring value)
- Range (the difference between minimum and maximum value)
- Standard deviation (the spread of the values)
- Sample size (total number of observations)
Example: Calculating Descriptive Statistics in Google Sheets
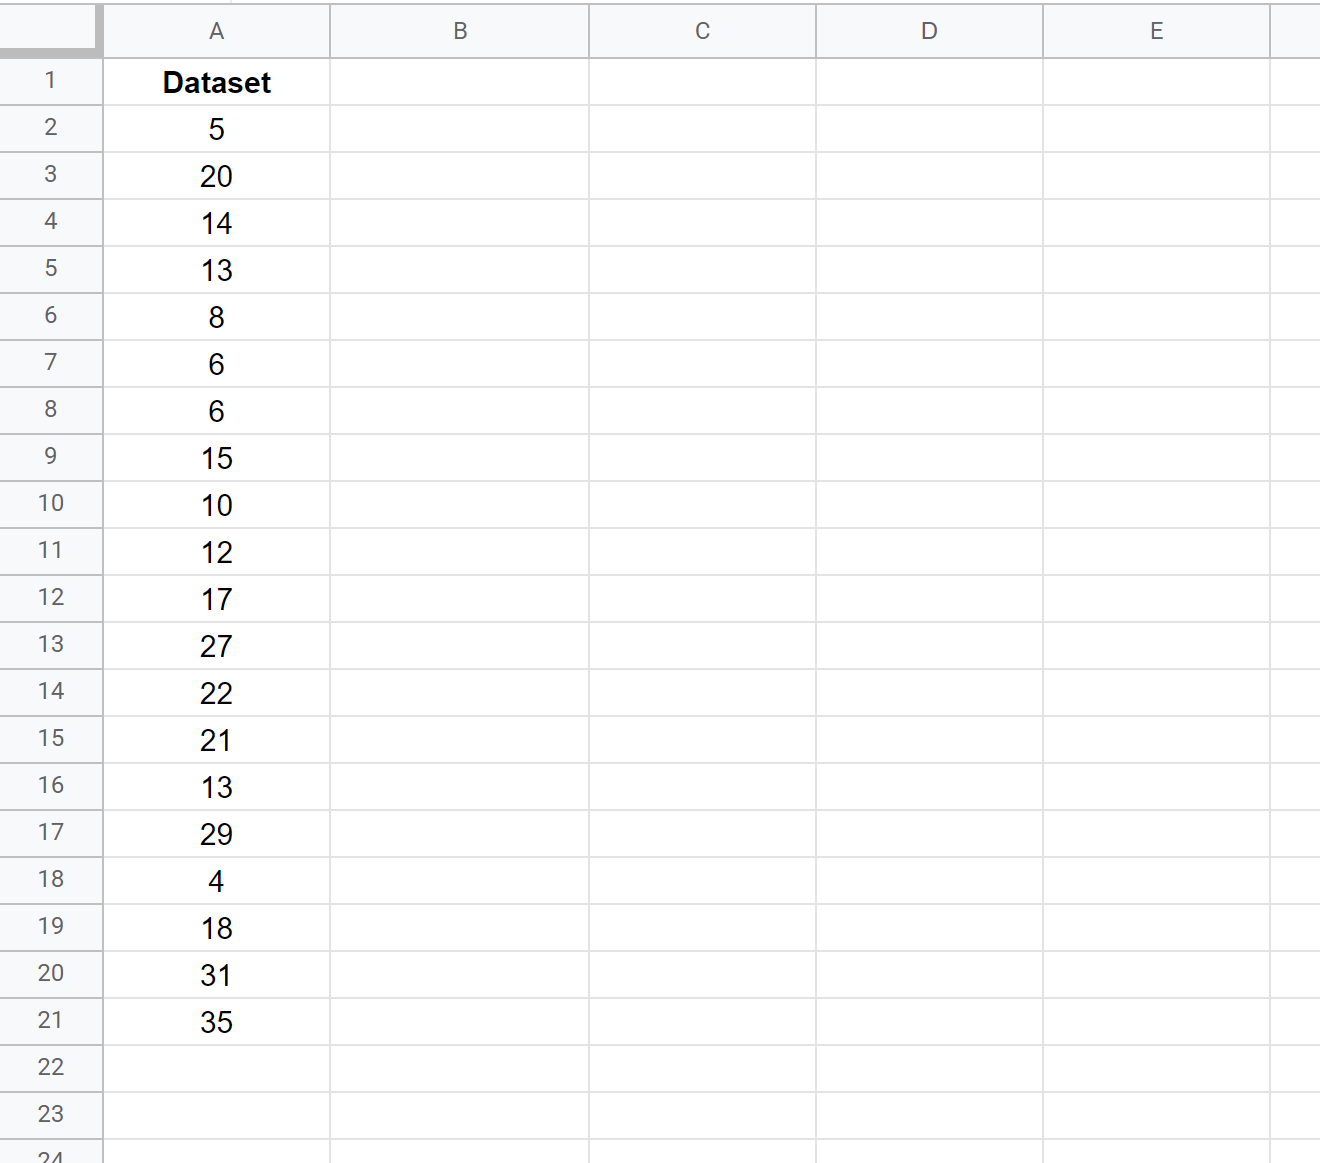
Suppose we have the following dataset with 20 values in Google Sheets:
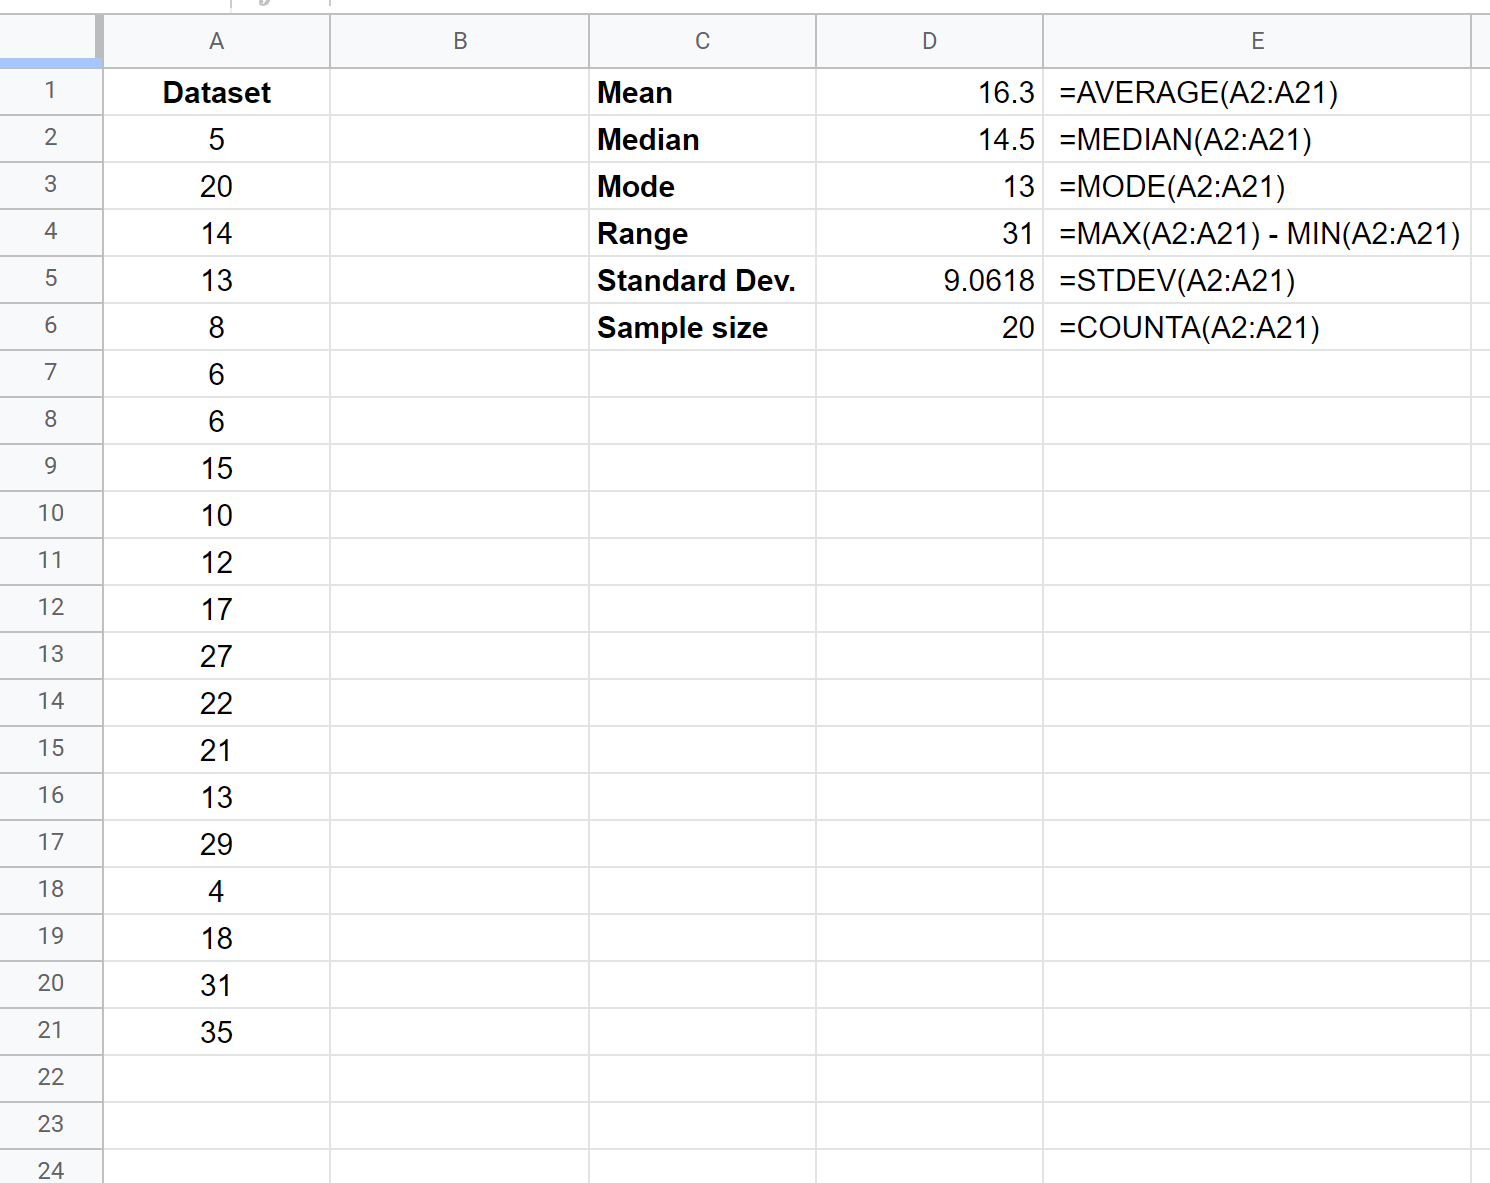
The following screenshot shows how to calculate various descriptive statistics for this dataset, including the formulas used:
We can use the following descriptive statistics to get an idea of where the center of the dataset is located:
- Mean: 16.3
- Median: 14.5
- Mode: 13
We can use the following descriptive statistics to get an idea of how spread out the values are in the dataset:
- Range: 31
- Standard Deviation: 9.0618
Lastly, we can use the following descriptive statistic to understand how many total observations are in the dataset:
- Sample Size: 20
Using these six descriptive statistics, we can gain a pretty good understanding of the distribution of values in this dataset.
Additional Resources
Descriptive vs. Inferential Statistics: What’s the Difference?
Range vs. Standard Deviation: When to Use Each
Mean vs. Median: When to Use Each