You can use the cumsum() function from base R to easily calculate the cumulative sum of a vector of numeric values.
This tutorial explains how to use this function to calculate the cumulative sum of a vector along with how to visualize a cumulative sum.
How to Calculate a Cumulative Sum in R
The following code shows how to calculate the cumulative sum of sales for a given company over the course of 15 sales quarters:
#create dataset
data #create new column in dataset that contains cumulative sales
data$cum_sales cumsum(data$sales)

#view dataset
data

   quarter sales cum_sales
1        1     1         1
2        2     2         3
3        3     2         5
4        4     5        10
5        5     4        14
6        6     7        21
7        7     5        26
8        8     7        33
9        9     6        39
10      10     8        47
11      11     5        52
12      12     9        61
13      13    11        72
14      14    12        84
15      15     4        88
The values shown in the cum_sales column represent the total sales up to and including that quarter. For example, the cumulative sales in quarter 5 are calculated as: 1+2+2+5+4 = 14.
How to Visualize a Cumulative Sum in R
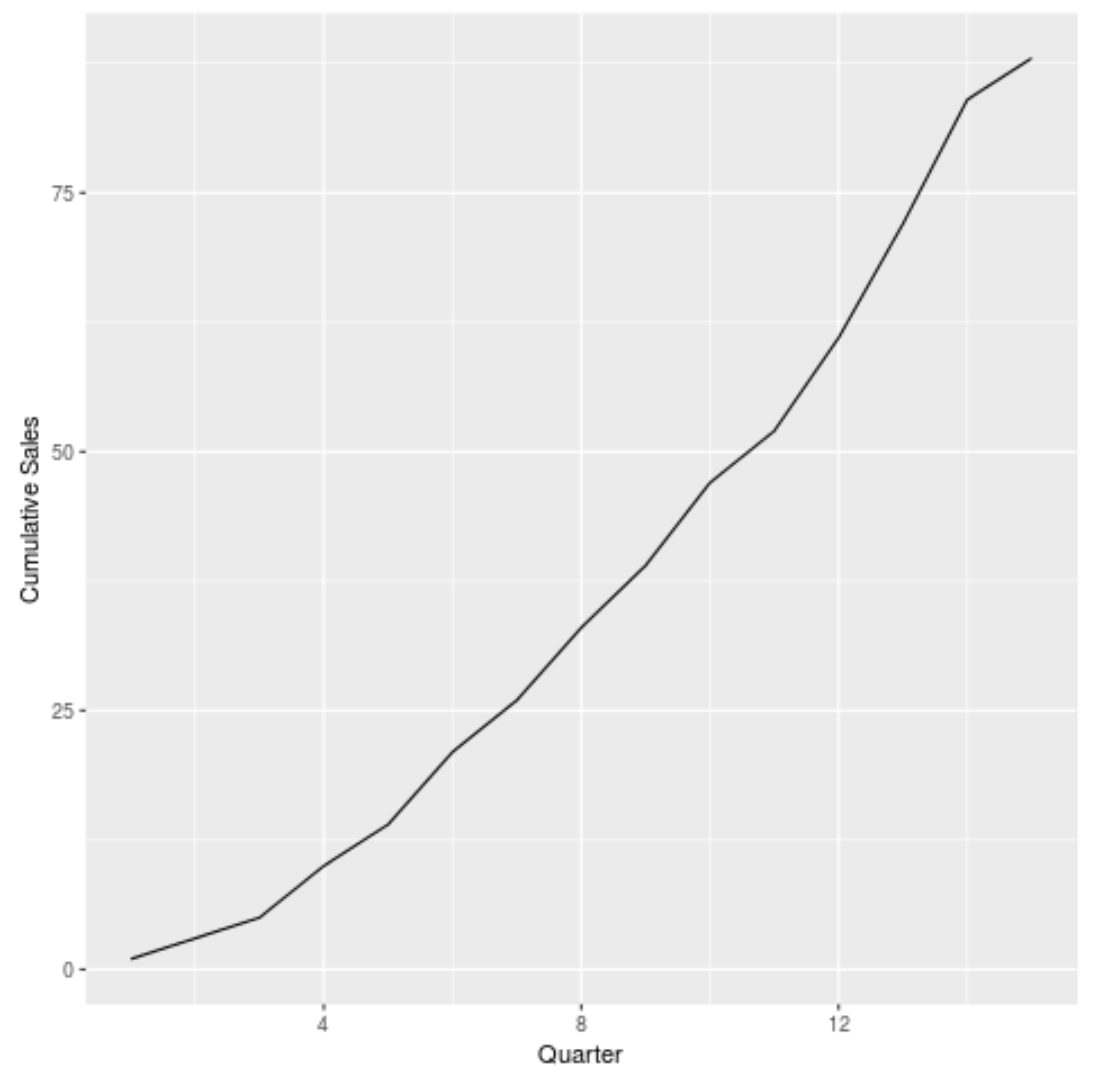
Once we’ve calculated the cumulative sales, we can create a simple line chart in base R to visualize the cumulative sales by quarter:
plot(data$cum_sales, type='l', xlab='Quarter', ylab='Cumulative Sales')

Alternatively, we can use the R visualization library ggplot2 to create the same line chart:
library(ggplot2)

ggplot(data, aes(x=quarter, y=cum_sales)) +
  geom_line() +
  labs(x='Quarter', y='Cumulative Sales')
Additional Resources
How to Average Across Columns in R
How to Sum Specific Columns in R
How to Perform a COUNTIF Function in R