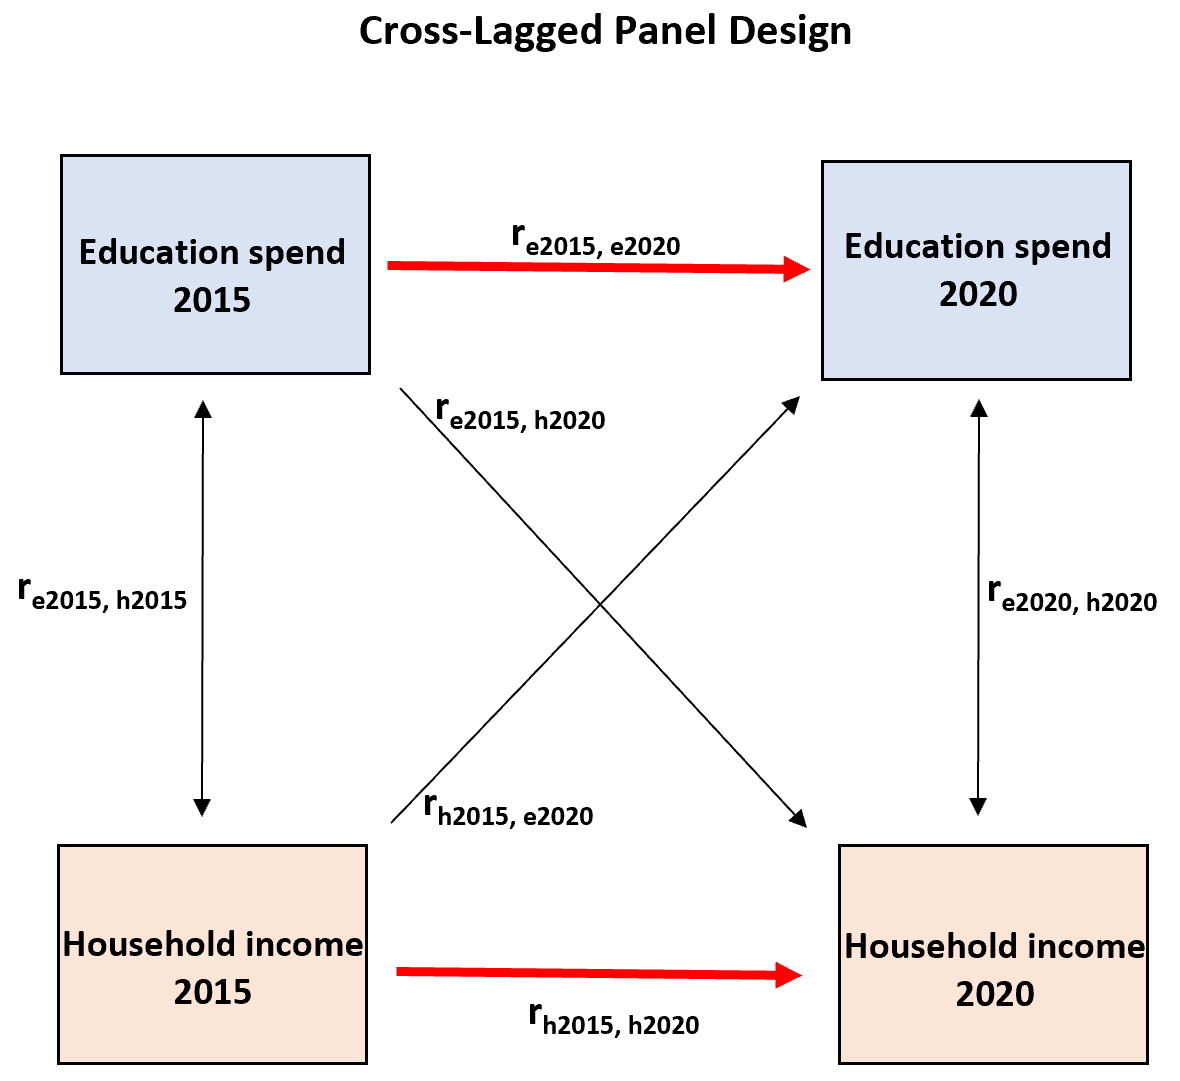
A cross-lagged panel design is a type of structural equation model that measures two different variables at two points in time.
For example, suppose we measure the total amount of money spent on education and the median household income in a certain country during two different points in time.
We could use the following diagram to visualize this cross-lagged panel design:
Note: re2015, h2015 indicates the correlation between education spend in 2015 and median household income in 2015.
The name “cross” comes from the fact that we’re analyzing the relationship from one variable to another and vice-versa.
The name “lagged” comes from the fact that we’re measuring both variables at two different points in time.
How to Assess a Cross-Lagged Panel Design
A cross-lagged panel design estimates a total of six relations:
Two synchronous relations. This design measures the synchronous relations between the two variables at the same time points:
Two stability relations. This design measures the stability relations between the same variables at different points in time:
Two cross-lagged relations. This design measures the cross-lagged relations between the two variables at different points in time:
If either of the cross-lagged correlations are significantly different from zero, it’s assumed that there exists a causal relationship between the two variables at the two different points in time.
For example, if re2015, h2020 is significantly different from zero then it’s assumed that education spend causes a change in household income.
Assumptions of a Cross-Lagged Panel Design
A cross-lagged panel design is considered a valid way to identify causal relationships between variables, but it makes a couple crucial assumptions:
Synchronicity: This design assumes that the measurements on the two variables at each point in time were made at the exact same time.
Stationarity: This design assumes that the variables and the relationships between the variables remain constant over time.
If these assumptions are violated, it may not be valid to use this type of model to identify causal relationships.
Additional Resources
Matched Pairs Design: Definition & Examples
Pretest-Posttest Design: Definition & Examples
Split-Plot Design: Definition & Examples


