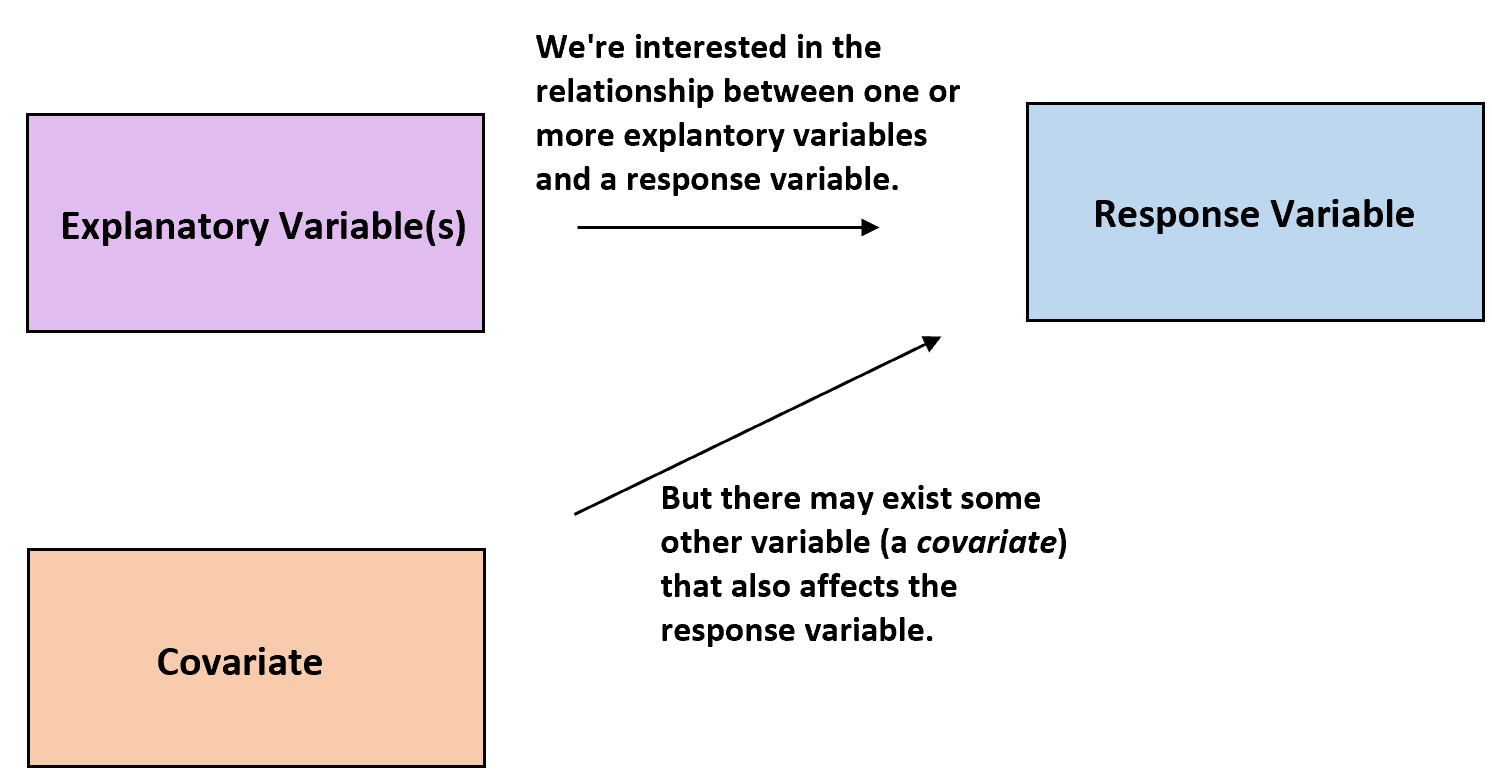
In statistics, researchers are often interested in understanding the relationship between one or more explanatory variables and a response variable.
However, occasionally there may be other variables that can affect the response variable that are not of interest to researchers. These variables are known as covariates.
Covariates: Variables that affect a response variable, but are not of interest in a study.
For example, suppose researchers want to know if three different studying techniques lead to different average exam scores at a certain school. The studying technique is the explanatory variable and the exam score is the response variable.
However, there’s bound to exist some variation in the student’s studying abilities within the three groups. If this isn’t accounted for, it will be unexplained variation within the study and will make it harder to actually see the true relationship between studying technique and exam score.
One way to account for this could be to use the student’s current grade in the class as a covariate. It’s well known that the student’s current grade is likely correlated with their future exam scores.
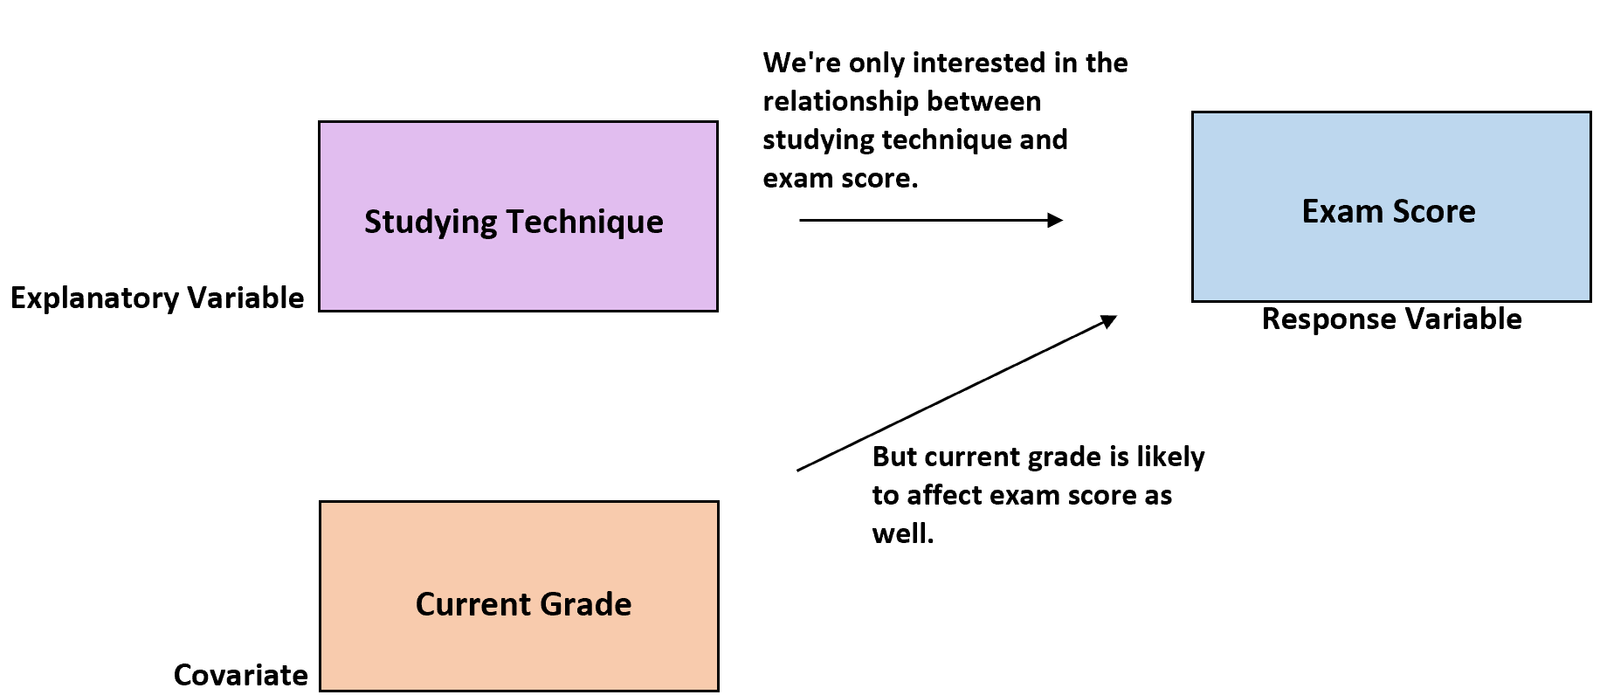
Thus, although current grade is not a variable of interest in this study, it can be included as a covariate so that researchers can see if studying technique affects exam scores even after accounting for the student’s current grade in the class.
Covariates appear most often in two types of settings: ANOVA (analysis of variance) and Regression.
Covariates in ANOVA
When we perform an ANOVA (whether it’s a one-way ANOVA, two-way ANOVA, or something more complex), we’re interested in finding out whether or not there is a difference between the means of three or more independent groups.
In our previous example, we were interested in understanding whether or not there was a difference in mean exam scores between three different studying techniques. To understand this, we could have conducted a one-way ANOVA.
However, since we knew that a student’s current grade was also likely to affect exam scores we could include it as a covariate and instead perform an ANCOVA (analysis of covariance).
This is similar to an ANOVA, except that we include a continuous variable (student’s current grade) as a covariate so that we can understand whether or not there is a difference in mean exam scores between the three studying techniques, even after accounting for the student’s current grade.
Covariates in Regression
When we perform a linear regression, we’re interested in quantifying the relationship between one or more explanatory variables and a response variable.
For example, we could run a simple linear regression to quantify the relationship between square footage and house prices in a certain city. However, it may be known that the age of a house is also a variable that affects house price.
In particular, older houses may be correlated with lower house prices. In this case, the age of the house would be a covariate since we’re not actually interested in studying it, but we know that it has an effect on house price.
Thus, we could include house age as an explanatory variable and run a multiple linear regression with square footage and house age as explanatory variables and house price as the response variable.
Thus, the regression coefficient for square footage would then tell us the average change in house price associated with a one unit increase in square footage after accounting for house age.
Additional Resources
An Introduction to ANCOVA (Analysis of Variance)
How to Interpret Regression Coefficients
How to Perform an ANCOVA in Excel
How to Perform Multiple Linear Regression in Excel