Variance and covariance are two terms used often in statistics. Although they sound similar, they’re quite different.
Variance measures how spread out values are in a given dataset.
Covariance measures how changes in one variable are associated with changes in a second variable.
This tutorial provides a brief explanation of each term along with examples of how to calculate each.
Variance: Formula, Example, and When to Use
Variance measures how spread out values are in a given dataset.
Formula:
The formula to find the variance of a sample (denoted as s2) is:
s2 = Σ (xi – x)2 / (n-1)
where:
- x: The sample mean
- xi: The ith observation in the sample
- N: The sample size
- Σ: A Greek symbol that means “sum”
Example:
Suppose we have the following dataset with 10 values:
Dataset: 6, 7, 10, 13, 14, 14, 18, 19, 22, 24
Using a calculator, we can find that the sample variance is 36.678.
Now suppose we had another dataset with 10 values:
Dataset: 6, 13, 19, 24, 25, 30, 36, 43, 49, 55
The sample variance of this dataset turns out to be 248.667.
The variance of the second dataset is much larger than the first, which indicates that the values in the second dataset are much more spread out compared to the values in the first dataset.
When to Use:
We use variance when we want to quantify how spread out values are in a dataset. The higher the variance, the more spread out values the values are. The value for variance can range from zero (no spread at all) to any number greater than zero.
Covariance: Definition, Example, and When to Use
Covariance measures how changes in one variable are associated with changes in a second variable.
Formula:
The formula to find the covariance between two variables, X and Y is:
COV(X, Y) = Σ(xi–x)(yi–y) / n
where:
- x: The sample mean of variable X
- xi: The ith observation of variable X
- y: The sample mean of variable Y
- yi: The ith observation of variable Y
- n: The total number of pairwise observations
- Σ: A Greek symbol that means “sum”
Example:
Suppose we have the following dataset with 10 values:
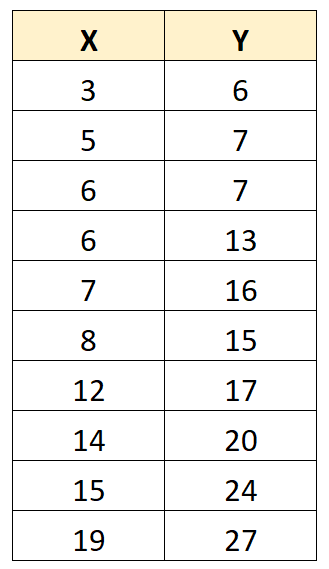
Using a calculator, we can find that the covariance between X and Y is 31.8.
Since this value is positive, it tells us that as the values for X increase, the values for Y tend to increase as well.
Now suppose we had another dataset with 10 values:
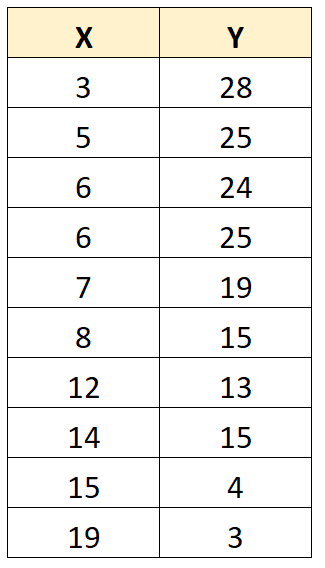
Using a calculator, we can find that the covariance between X and Y is -38.55.
Since this value is negative, it tells us that as the values for X increase, the values for Y tend to decrease.
When to Use:
We use covariance when we want to quantify the relationship between two variables. A positive value for covariance indicates a positive relationship between two variables while a negative value indicates a negative relationship between two variables.
Additional Resources
Measures of Dispersion: Variance, Standard Deviation, & Interquartile Range
Covariance Matrix Calculator