Covariance is a measure of how changes in one variable are associated with changes in a second variable. Specifically, it’s a measure of the degree to which two variables are linearly associated.
A covariance matrix is a square matrix that shows the covariance between many different variables. This can be a useful way to understand how different variables are related in a dataset.
The following example shows how to create a covariance matrix in Python.
How to Create a Covariance Matrix in Python
Use the following steps to create a covariance matrix in Python.
Step 1: Create the dataset.
First, we’ll create a dataset that contains the test scores of 10 different students for three subjects: math, science, and history.
import numpy as np

math = [84, 82, 81, 89, 73, 94, 92, 70, 88, 95]
science = [85, 82, 72, 77, 75, 89, 95, 84, 77, 94]
history = [97, 94, 93, 95, 88, 82, 78, 84, 69, 78]

data = np.array([math, science, history])
Step 2: Create the covariance matrix.
Next, we’ll create the covariance matrix for this dataset using the numpy function cov(), specifying that bias = True so that we are able to calculate the population covariance matrix.
np.cov(data, bias=True)

array([[ 64.96,  33.2 , -24.44],
       [ 33.2 ,  56.4 , -24.1 ],
       [-24.44, -24.1 ,  75.56]])
Step 3: Interpret the covariance matrix.
The values along the diagonals of the matrix are simply the variances of each subject. For example:
- The variance of the math scores is 64.96
- The variance of the science scores is 56.4
- The variance of the history scores is 75.56
The other values in the matrix represent the covariances between the various subjects. For example:
- The covariance between the math and science scores is 33.2
- The covariance between the math and history scores is -24.44
- The covariance between the science and history scores is -24.1
A positive number for covariance indicates that two variables tend to increase or decrease in tandem. For example, math and science have a positive covariance (33.2), which indicates that students who score high on math also tend to score high on science. Conversely, students who score low on math also tend to score low on science.
A negative number for covariance indicates that as one variable increases, a second variable tends to decrease. For example, math and history have a negative covariance (-24.44), which indicates that students who score high on math tend to score low on history. Conversely, students who score low on math tend to score high on history.
Step 4: Visualize the covariance matrix (optional).
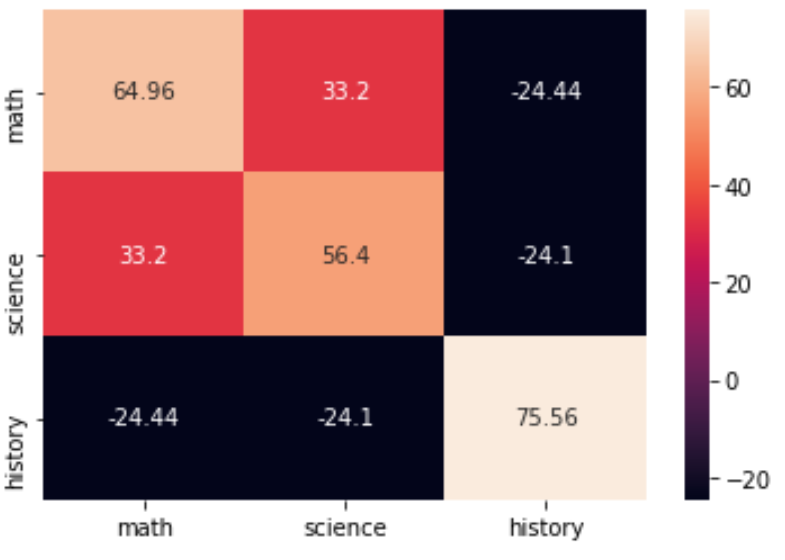
You can visualize the covariance matrix by using the heatmap() function from the seaborn package:
import seaborn as sns
import matplotlib.pyplot as plt

cov = np.cov(data, bias=True)
labs = ['math', 'science', 'history']

sns.heatmap(cov, annot=True, fmt='g', xticklabels=labs, yticklabels=labs)
plt.show()
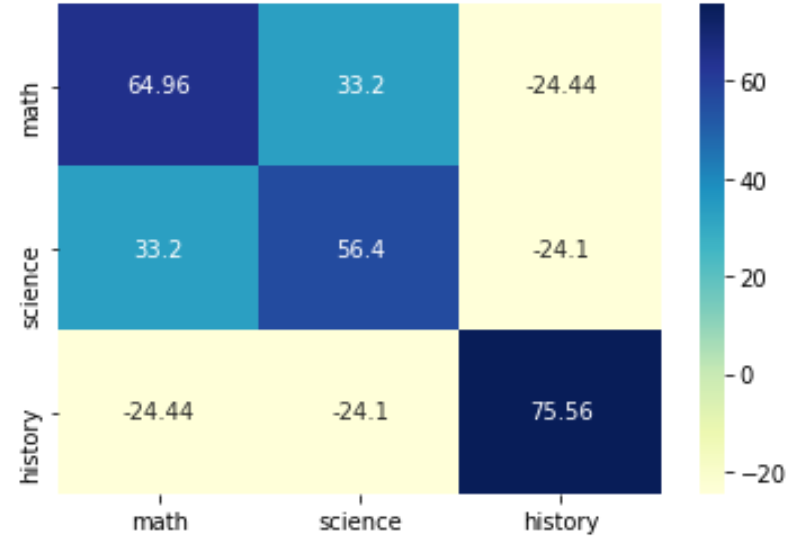
You can also change the colormap by specifying the cmap argument:
sns.heatmap(cov, annot=True, fmt='g', xticklabels=labs, yticklabels=labs, cmap='YlGnBu')
plt.show()
For more details on how to style this heatmap, refer to the seaborn documentation.