Covariance is a measure of how changes in one variable are associated with changes in a second variable. Specifically, it’s a measure of the degree to which two variables are linearly associated.
The formula to calculate the covariance between two variables, X and Y is:
COV(X, Y) = Σ(x-x)(y-y) / n
A covariance matrix is a square matrix that shows the covariance between many different variables. This can be a useful way to understand how different variables are related in a dataset.
The following example shows how to create a covariance matrix in Google Sheets for a given dataset.
How to Create a Covariance Matrix in Google Sheets
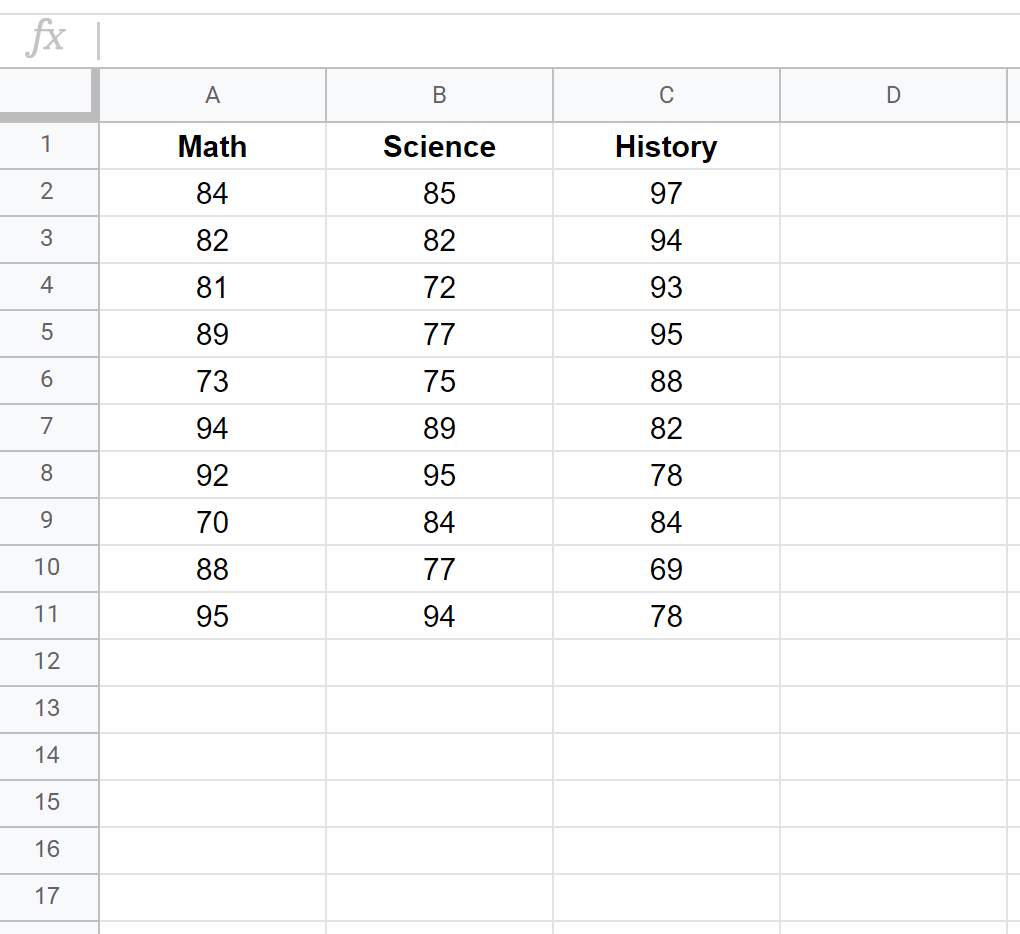
Suppose we have the following dataset that shows the test scores of 10 different students for three subjects: math, science, and history.
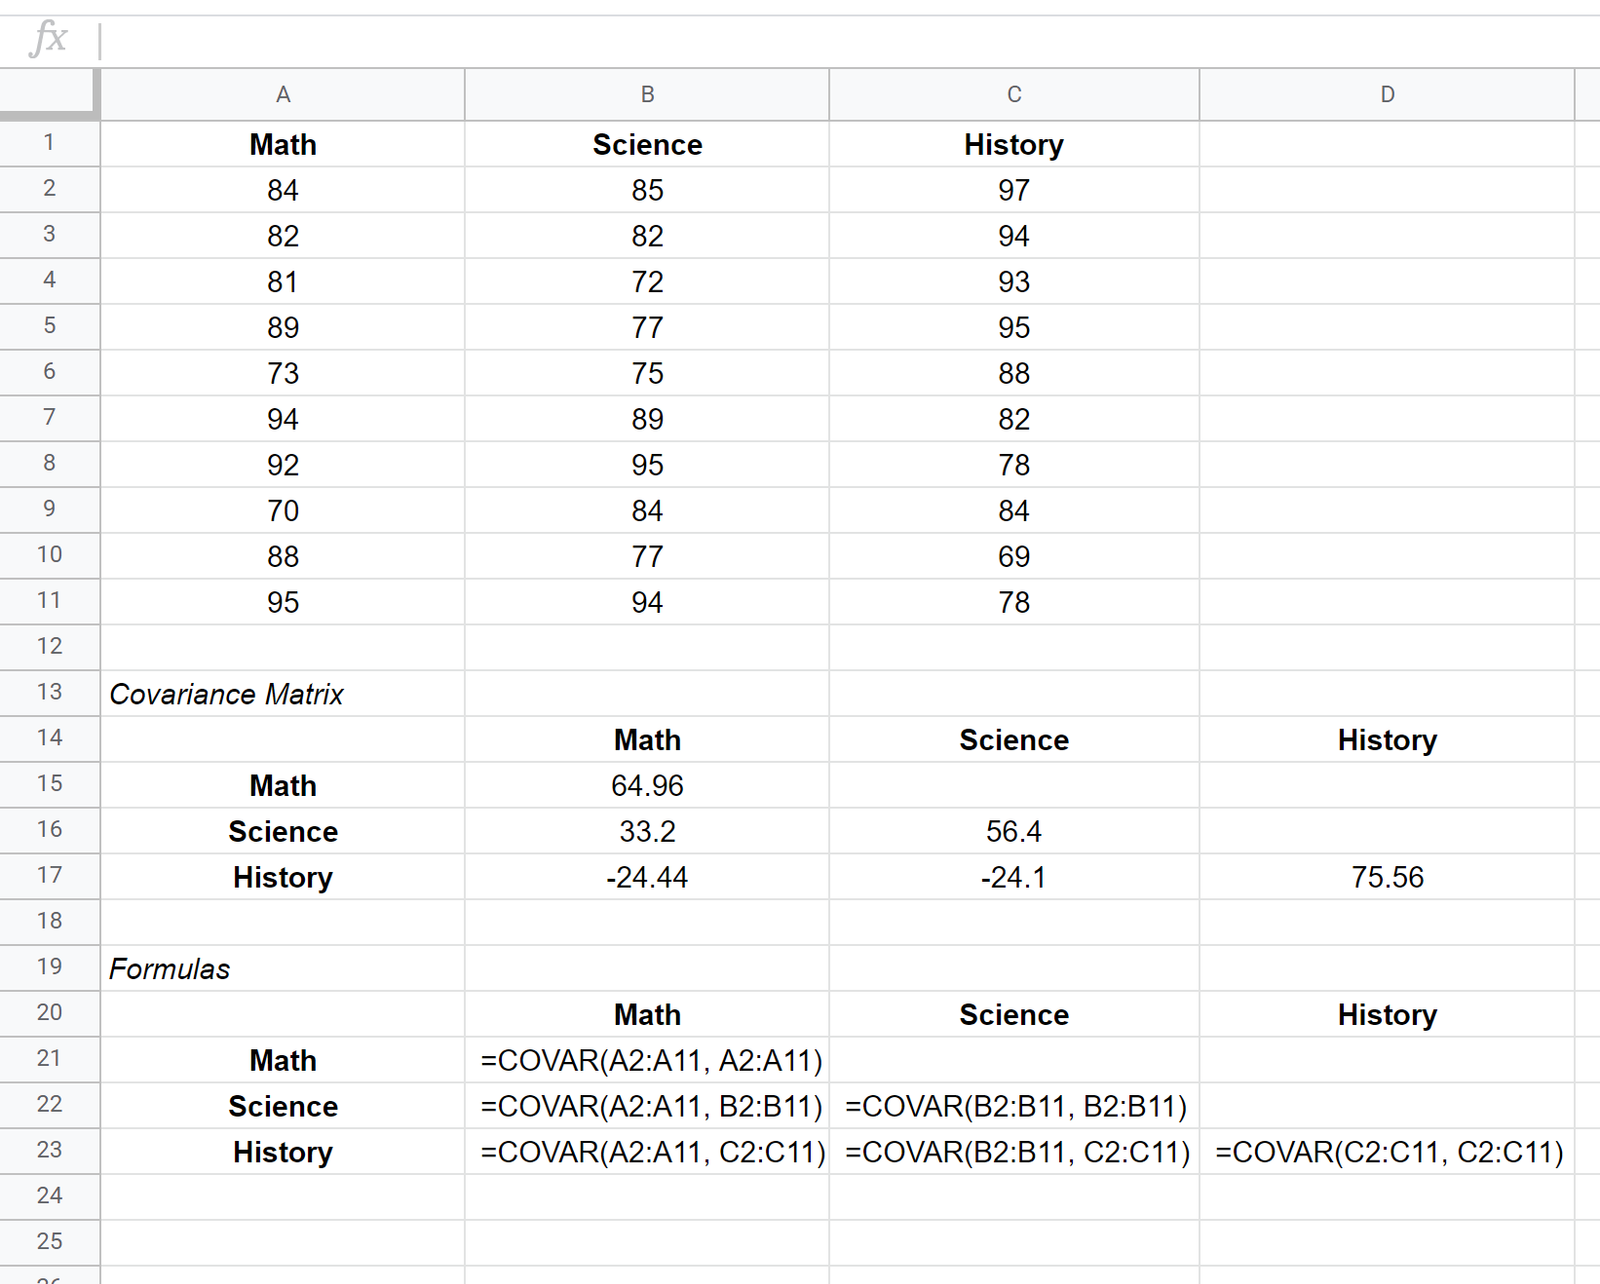
To create a covariance matrix for this dataset, we can use the COVAR() function with the following syntax:
COVAR(data_y, data_x)
The covariance matrix for this dataset is shown in cells B15:D17 while the formulas used to create the covariance matrix are shown in cells B21:D23 below:
How to Interpret a Covariance Matrix
Once we have a covariance matrix, it’s simple to interpret the values in the matrix.
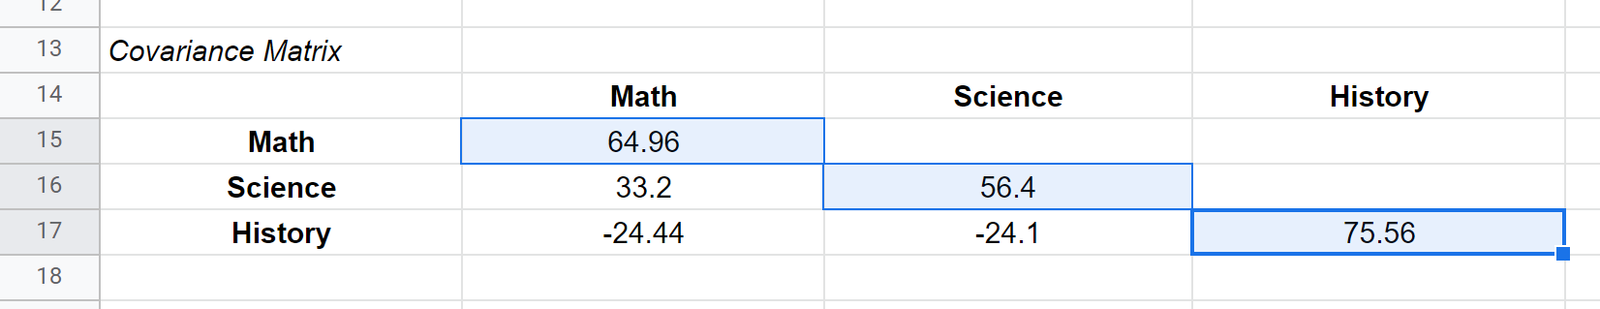
The values along the diagonals of the matrix are simply the variances of each subject. For example:
- The variance of the math scores is 64.96
- The variance of the science scores is 56.4
- The variance of the history scores is 75.56
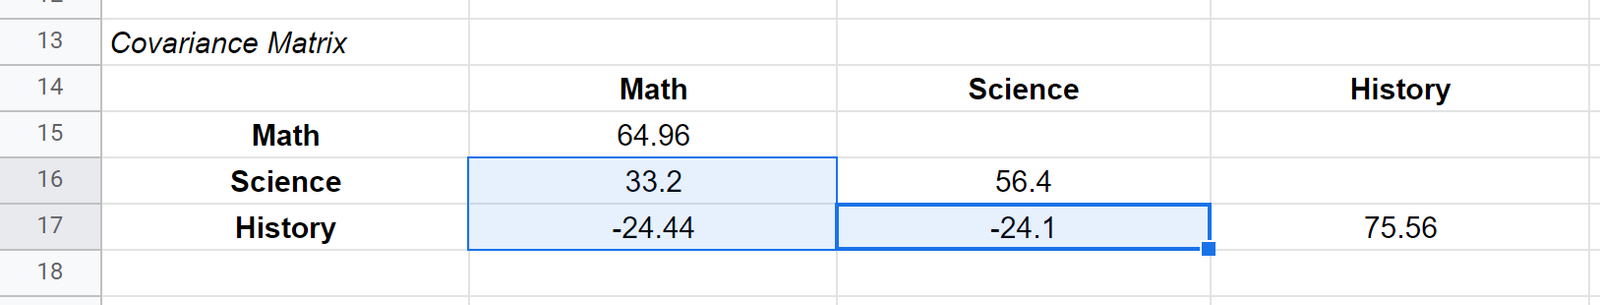
The other values in the matrix represent the covariances between the various subjects. For example:
- The covariance between the math and science scores is 33.2
- The covariance between the math and history scores is -24.44
- The covariance between the science and history scores is -24.1
A positive number for covariance indicates that two variables tend to increase or decrease in tandem. For example, math and science have a positive covariance (33.2), which indicates that students who score high on math also tend to score high on science. Likewise, students who score low on math also tend to score low on science.
A negative number for covariance indicates that as one variable increases, a second variable tends to decrease. For example, math and history have a negative covariance (-24.44), which indicates that students who score high on math tend to score low on history. Likewise, students who score low on math tend to score high on history.
Additional Resources
How to Create a Covariance Matrix in Excel
How to Create a Covariance Matrix in R
How to Create a Covariance Matrix in Python
How to Create a Covariance Matrix in SPSS