One way to quantify the relationship between two variables is to use the Pearson correlation coefficient, which measures the linear association between two variables.
It always takes on a value between -1 and 1 where:
- -1 indicates a perfectly negative linear correlation between two variables
- 0 indicates no linear correlation between two variables
- 1 indicates a perfectly positive linear correlation between two variables
The further away the correlation coefficient is from zero, the stronger the relationship between the two variables.
The following examples show how to use proc corr in SAS to calculate the correlation coefficient between variables in the SAS built-in dataset called Fish, which contains various measurements for 159 different fish caught in a lake in Finland.
We can use proc print to view the first 10 observations from this dataset:
/*view first 10 observations from Fish dataset*/
proc print data=sashelp.Fish (obs=10);

run;
Example 1: Correlation Between Two Variables
We can use the following code to calculate the Pearson correlation coefficient between the variables Height and Width:
/*calculate correlation coefficient between Height and Width*/
proc corr data=sashelp.fish;
	var Height Width;

run;
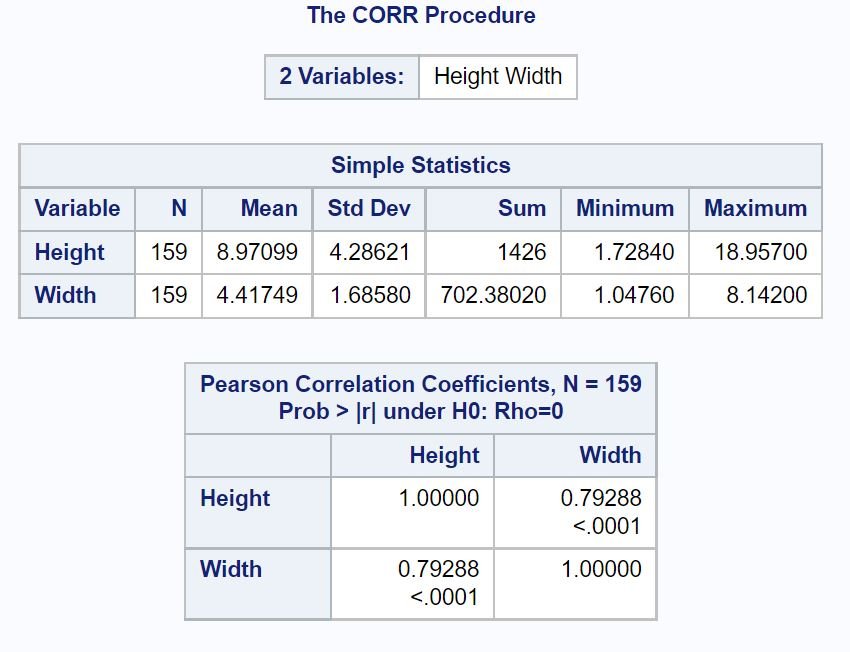
The first table displays summary statistics for both Height and Width.
The second table displays the Pearson correlation coefficient between the two variables, including a p-value that tells us if the correlation is statistically significant.
From the output we can see:
- Pearson correlation coefficient: 0.79288
- P-value: <.0001>
This tells us that there is a strong positive correlation between Height and Width and that the correlation is statistically significant since the p-value is less than α = .05.
Related: What is Considered to Be a “Strong” Correlation?
Example 2: Correlation Between All Variables
We can use the following code to calculate the Pearson correlation coefficient between all pairwise combinations of variables in the dataset:
/*calculate correlation coefficient between all pairwise combinations of variables*/
proc corr data=sashelp.fish;

run;
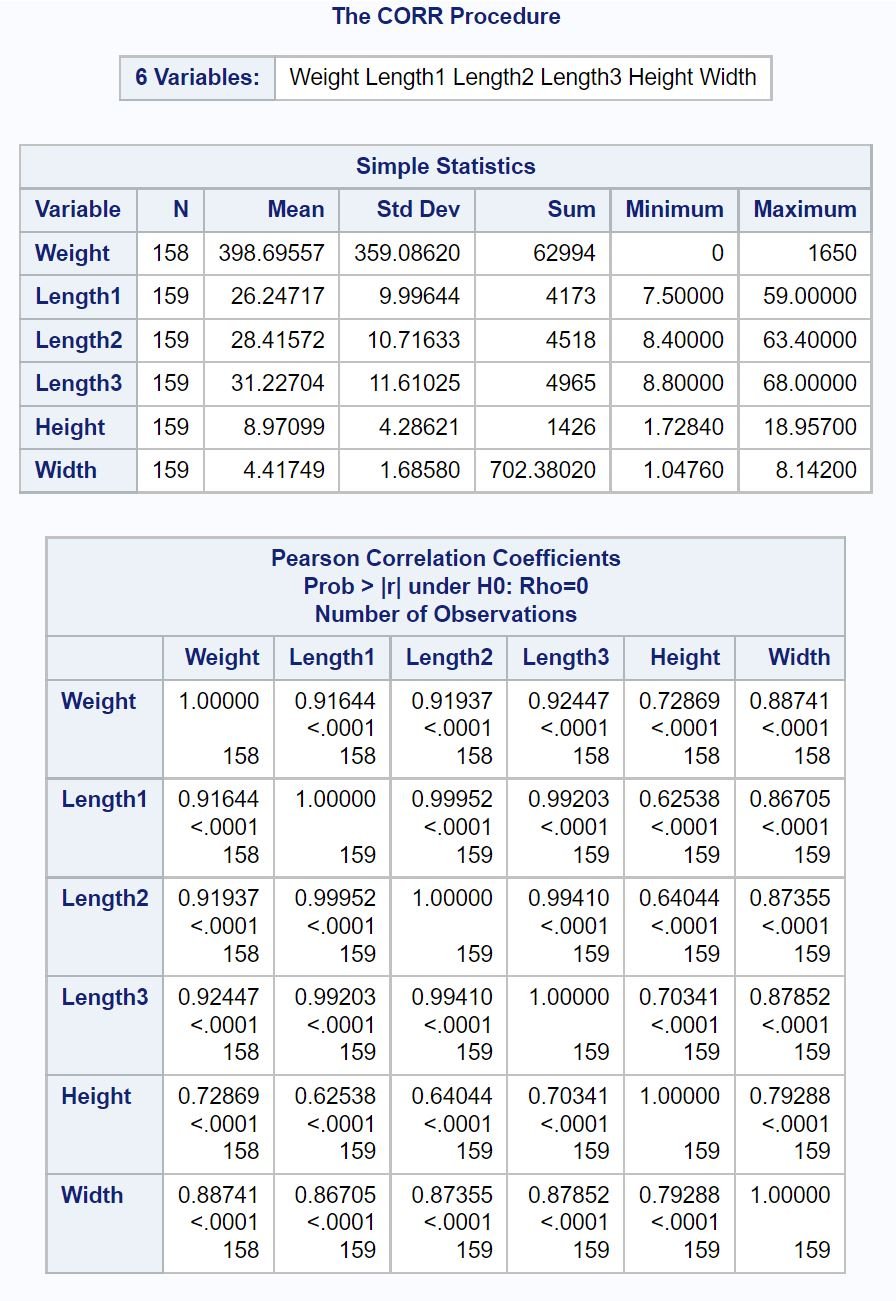
The output shows a correlation matrix, which contains the Pearson correlation coefficient and corresponding p-values for each pairwise combination of numeric variables in the dataset.
For example:
- The Pearson correlation coefficient between Weight and Length1 is 0.91644
- The Pearson correlation coefficient between Weight and Length2 is 0.91937
- The Pearson correlation coefficient between Weight and Length3 is 0.92447
And so on.
Example 3: Visualize Correlation with a Scatterplot
We can also use the plots function to create a scatterplot to visualize the correlation between two variables:
/*visualize correlation between Height and Width*/
proc corr data=sashelp.fish plots=scatter(nvar=all);;
	var Height Width;

run;
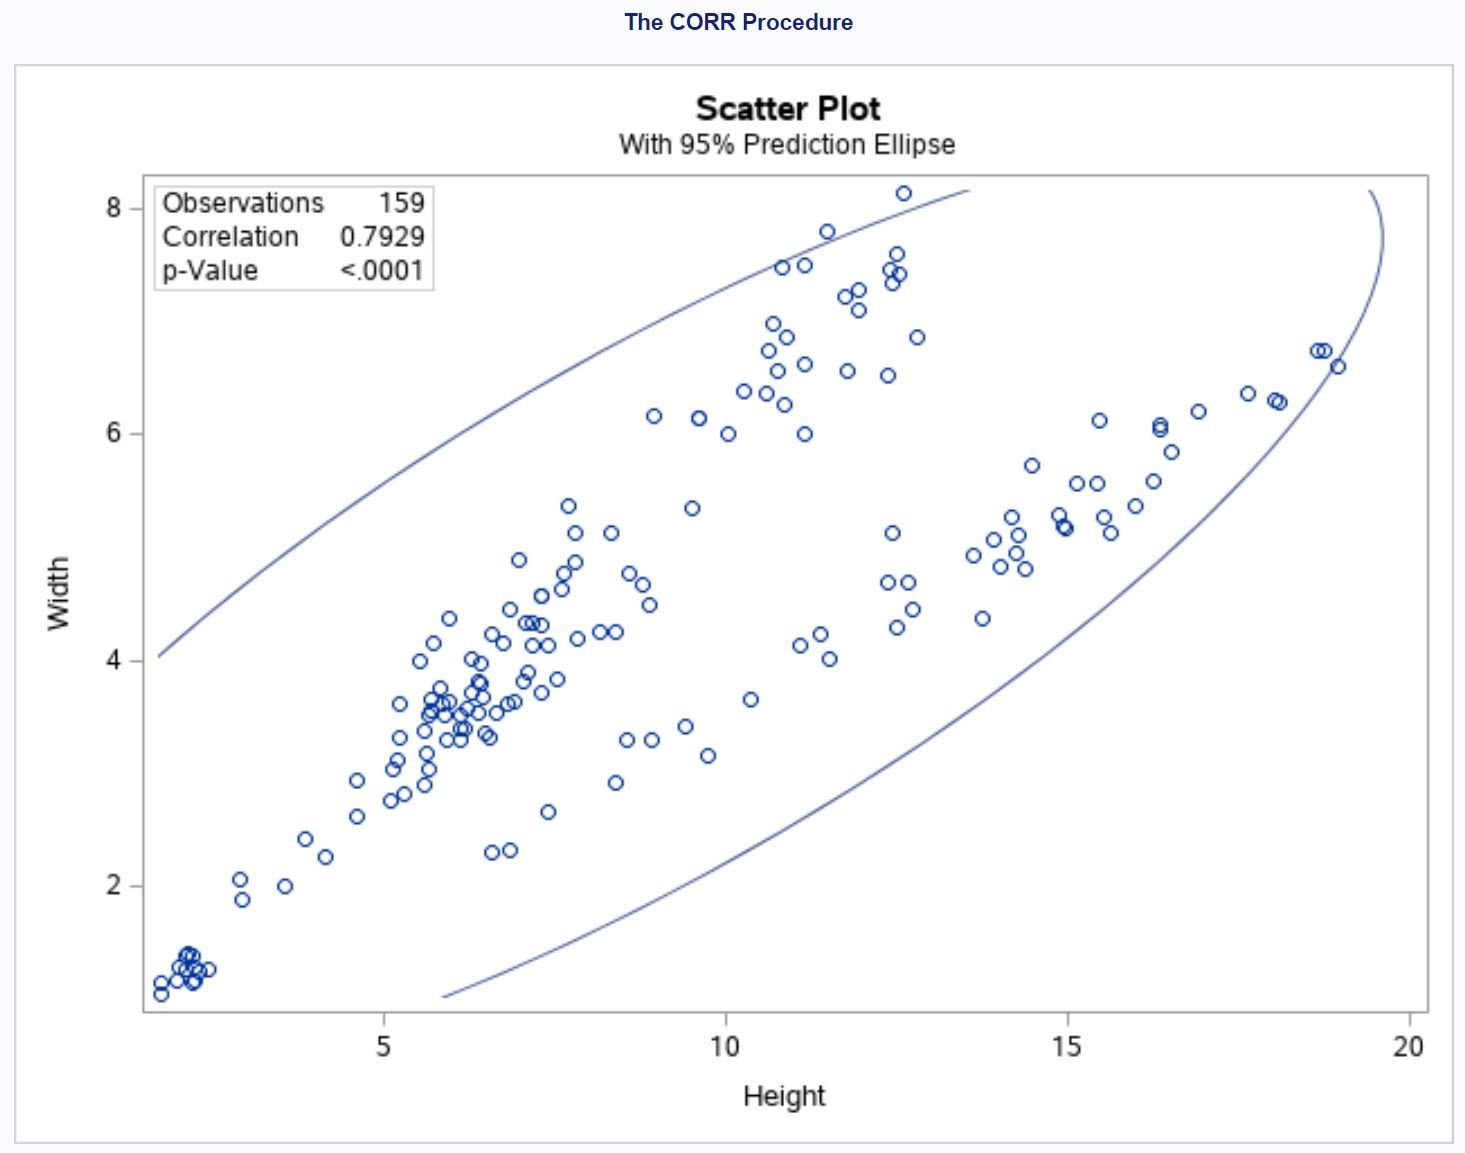
From the plot we can see the strong positive correlation between Height and Width. As Height increases, Width tends to increase as well.
In the top left corner of the plot we can also see the total observations used, the correlation coefficient, and the p-value for the correlation coefficient.
Additional Resources
The following tutorials explain how to perform other common operations in SAS:
How to Create Frequency Tables in SAS
How to Calculate Descriptive Statistics in SAS


