One way to quantify the relationship between two variables is to use the Pearson correlation coefficient, which is a measure of the linear association between two variables. It always takes on a value between -1 and 1 where:
- -1 indicates a perfectly negative linear correlation between two variables
- 0 indicates no linear correlation between two variables
- 1 indicates a perfectly positive linear correlation between two variables
This tutorial explains how to calculate the correlation between multiple variables in R, using the following data frame as an example:
#create data frame
df
Example 1: Correlation Between Two Variables
The following code shows how to calculate the correlation between two variables in the data frame:
cor(df$a, df$b)

[1] 0.9279869
Example 2: Correlation Between Multiple Variables
The following code shows how to calculate the correlation between three variables in the data frame:
cor(df[, c('a', 'b', 'c')])

          a         b         c
a 1.0000000 0.9279869 0.9604329
b 0.9279869 1.0000000 0.8942139
c 0.9604329 0.8942139 1.0000000
The way to interpret the output is as follows:
- The correlation between a and b is 0.9279869.
- The correlation between a and c is 0.9604329.
- The correlation between b and c is 0.8942139.
Example 3: Correlation Between All Variables
The following code shows how to calculate the correlation between all variables in a data frame:
cor(df)

           a          b          c          d
a  1.0000000  0.9279869  0.9604329 -0.7915488
b  0.9279869  1.0000000  0.8942139 -0.7917973
c  0.9604329  0.8942139  1.0000000 -0.8063549
d -0.7915488 -0.7917973 -0.8063549  1.0000000
Example 4: Correlation Between Only Numerical Variables
The following code shows how to calculate the correlation between only the numerical variables in a data frame:
cor(df[,unlist(lapply(df, is.numeric))])

           a          b          c          d
a  1.0000000  0.9279869  0.9604329 -0.7915488
b  0.9279869  1.0000000  0.8942139 -0.7917973
c  0.9604329  0.8942139  1.0000000 -0.8063549
d -0.7915488 -0.7917973 -0.8063549  1.0000000
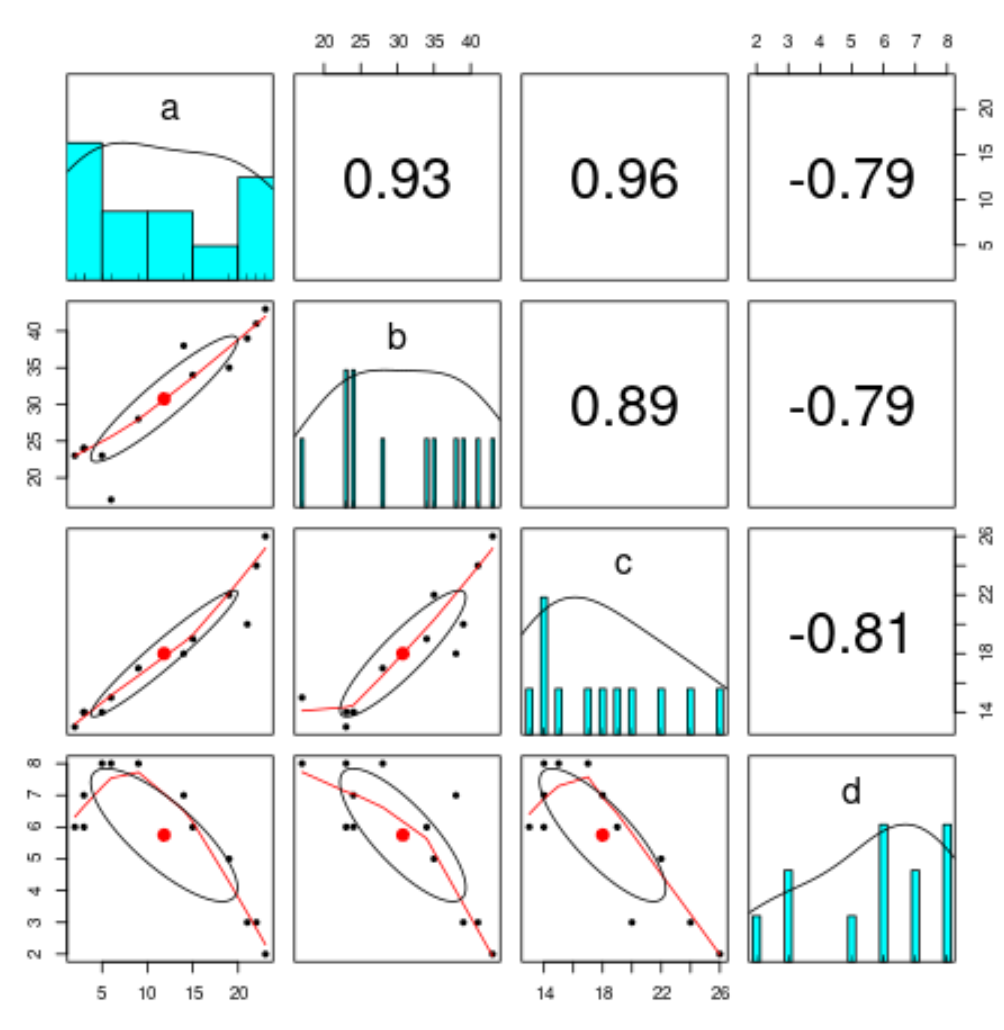
Example 5: Visualize Correlations
The following code shows how to create a pairs plot – a type of plot that lets you visualize the relationship between each pairwise combination of variables:
#load psych package
library(psych)

#create pairs plot
pairs.panels(df)
Additional Resources
How to Calculate Partial Correlation in R
How to Calculate Point-Biserial Correlation in R
How to Calculate Rolling Correlation in R