A z-score tells us how many standard deviations away a certain value is from the mean of a dataset.
A percentile tells us what percentage of observations fall below a certain value in a dataset.
Often we wish to convert between z-scores and percentiles, depending on the type of question we’re trying to answer. Fortunately, Excel has two built-in functions that make it easy to convert between the two.
How to Convert Z-Scores to Percentiles in Excel
We can use the following built-in Excel function to convert a z-score to a percentile:
=NORM.S.DIST(z, cumulative)
where:
- z = z-score of a certain data value
- cumulative = TRUE returns the cumulative distribution function; FALSE returns the probability distribution function. We will use TRUE to calculate percentiles.
For example, here is how to convert a z-score of 1.78 to a percentile:
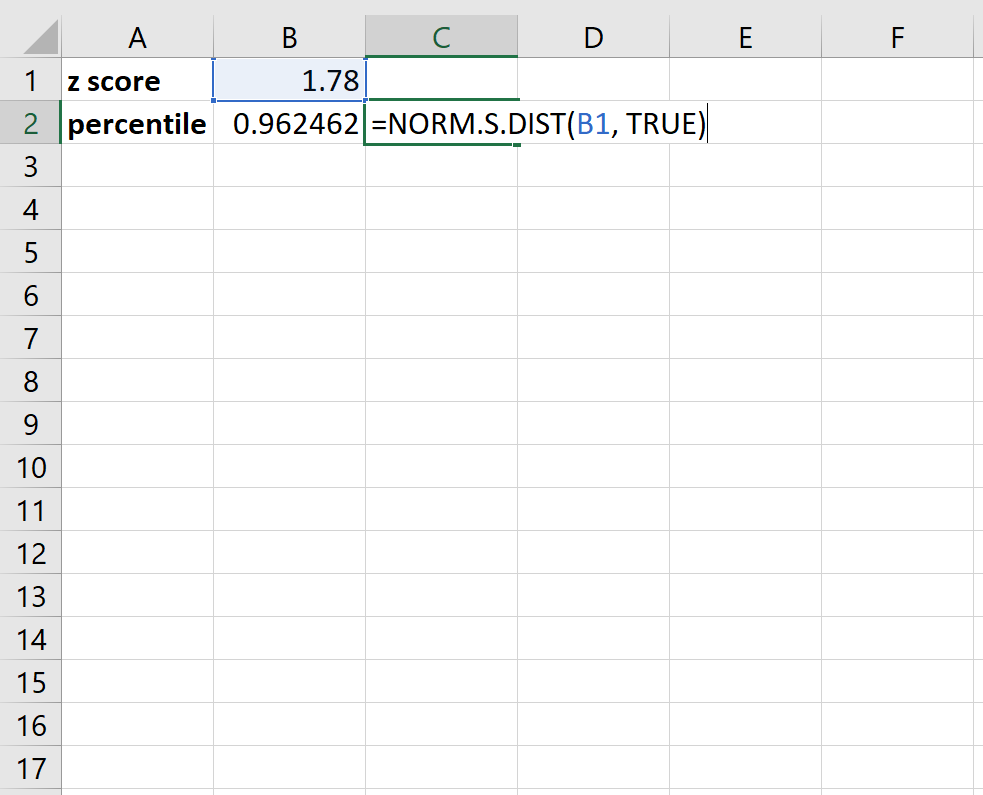
It turns out that a z-score of 1.78 corresponds to a percentile of roughly 96.2. In plain English, this means a data value that has a z-score of 1.78 is larger than roughly 96.2% of all other data values in the dataset.
How to Convert Percentiles to Z-Scores in Excel
We can use the following built-in Excel function to convert a percentile to a z-score:
=NORM.S.INV(probability)
where:
- probability = the percentile you’re interested in converting.
For example, here is how to convert a percentile of 0.85 to a z-score:
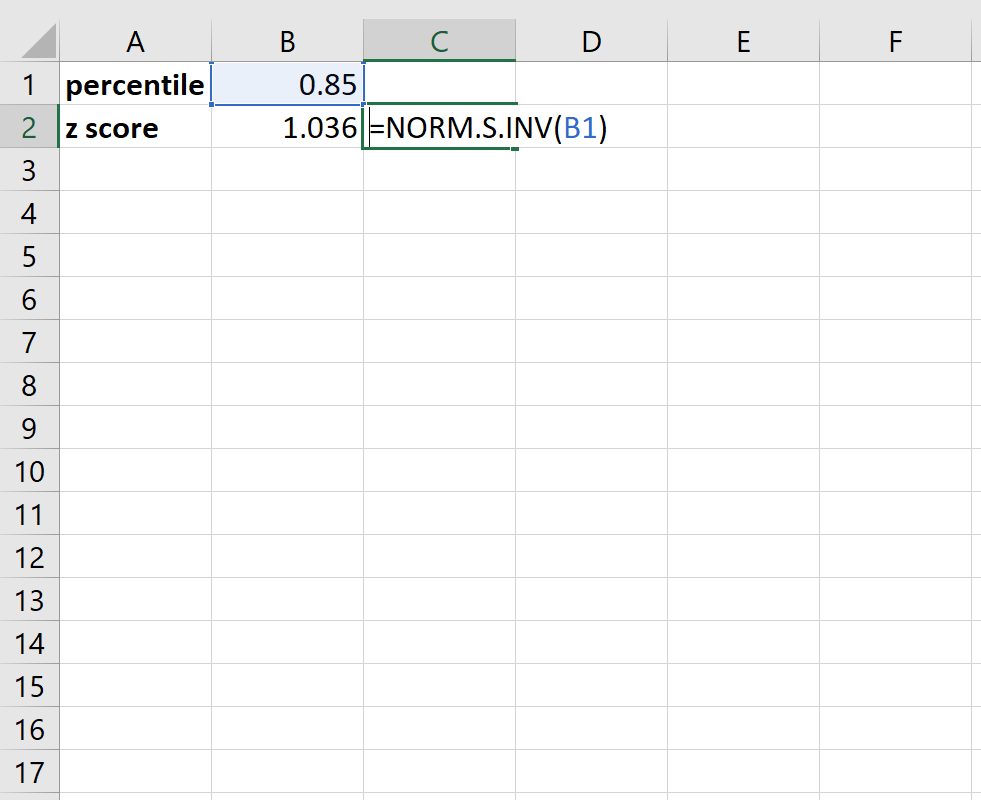
It turns out that a percentile of 0.85 corresponds to a z-score of roughly 1.036. In plain English, this means a data value located at the 85th percentile in a dataset has a z-score of 1.036.
The Relationship Between Percentiles and Z-Scores
Z-scores can take on any value between negative infinity and infinity. Percentiles, however, can only take on values between 0 and 100.
A z-score of 0 corresponds to a percentile of exactly 0.50. Thus, any z-score greater than 0 corresponds to a percentile greater than 0.50 and any z-score less than 0 corresponds to a percentile less than 0.50.
Depending on the type of question you’re trying to answer, it might be more helpful to know either the z-score or the percentile.
For example, suppose Jessica gets a 90% on a certain exam. This might seem like a high score, but what if the exam was really easy and her whole class did well on it? To determine how good her score is relative to all of the other scores in the class, we could calculate both the z-score and the percentile of her exam score.
If her exam score corresponds to a z-score of 1.23, this means her exam score was 1.23 standard deviations above the mean exam score. This z-score also correspond to a percentile of about 0.89, which means she scored higher than 89% of her classmates. Notice how both the z-score and the percentile provide us with useful information about her exam score.