A confidence interval for a proportion is a range of values that is likely to contain a population proportion with a certain level of confidence.
This tutorial explains the following:
- The motivation for creating a confidence interval for a proportion.
- The formula to create a confidence interval for a proportion.
- An example of how to calculate a confidence interval for a proportion.
- How to interpret a confidence interval for a proportion.
Confidence Interval for a Proportion: Motivation
The reason to create a confidence interval for a proportion is to capture our uncertainty when estimating a population proportion.
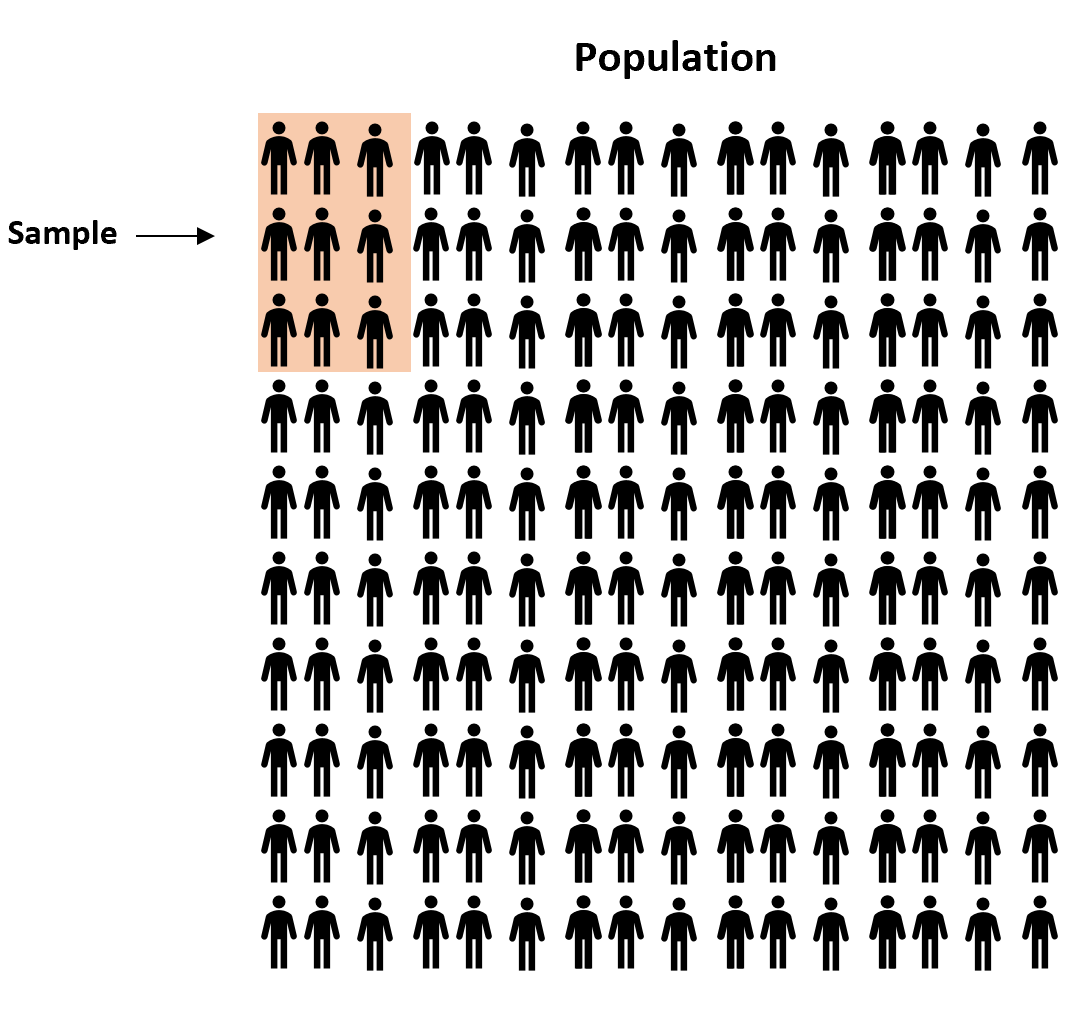
For example, suppose we want to estimate the proportion of people in a certain county that are in favor of a certain law. Since there are thousands of residents in the county, it would be too costly and time-consuming to go around and ask each resident about their stance on the law.
Instead, we might select a simple random sample of residents and ask each one whether or not they support the law:
Since we select a random sample of residents, there is no guarantee that the proportion of residents in the sample who are in favor of the law will exactly match the proportion of residents in the entire county who are in favor of the law.
So, to capture this uncertainty we can create a confidence interval that contains a range of values that are likely to contain the true proportion of residents who are in favor of the law in the entire county.
Confidence Interval for a Proportion: Formula
We use the following formula to calculate a confidence interval for a population proportion:
Confidence Interval = p +/- z*√p(1-p) / n
where:
- p: sample proportion
- z: the chosen z-value
- n: sample size
The z-value that you will use is dependent on the confidence level that you choose. The following table shows the z-value that corresponds to popular confidence level choices:
| Confidence Level | z-value |
|---|---|
| 0.90 | 1.645 |
| 0.95 | 1.96 |
| 0.99 | 2.58 |
Notice that higher confidence levels correspond to larger z-values, which leads to wider confidence intervals.
This means that, for example, a 95% confidence interval will be wider than a 90% confidence interval for the same set of data.
Related: What is Considered a Good Confidence Interval?
Confidence Interval for a Proportion: Example
Suppose we want to estimate the proportion of residents in a county that are in favor of a certain law. We select a random sample of 100 residents and ask them about their stance on the law. Here are the results:
- Sample size n = 100
- Proportion in favor of law p = 0.56
Here is how to find various confidence intervals for the population proportion:
90% Confidence Interval: 0.56 +/- 1.645*(√.56(1-.56) / 100) = [0.478, 0.642]
95% Confidence Interval: 0.56 +/- 1.96*(√.56(1-.56) / 100) = [0.463, 0.657]
99% Confidence Interval: 0.56 +/- 2.58*(√.56(1-.56) / 100) = [0.432, 0.688]
Note: You can also find these confidence intervals by using the Confidence Interval for Proportion Calculator.
Confidence Interval for a Proportion: Interpretation
The way we would interpret a confidence interval is as follows:
There is a 95% chance that the confidence interval of [0.463, 0.657] contains the true population proportion of residents who are in favor of this certain law.
Another way of saying the same thing is that there is only a 5% chance that the true population proportion lies outside of the 95% confidence interval.
That is, there’s only a 5% chance that the true proportion of residents in the county that support the law is less than 46.3% or greater than 65.7%.