In statistics, when we’re interested in determining whether or not there is a significant difference between two groups we often perform a hypothesis test, which results in a p-value.
If this p-value is less than some significance level (common choices are 0.10, 0.05, and 0.01), we conclude that there is a statistically significant difference between the two groups.
However, while a p-value can tell us whether or not there is a statistically significant difference between two groups, an effect size can tell us how large this difference actually is.
One of the most common measurements of effect size is Cohen’s d, which is calculated as:
Cohen’s d = (x1 – x2) / pooled SD
where:
- x1 = mean of group 1
- x2 = mean of group 2
- pooled SD = √(s12 + s22) / 2
This tutorial explains how to calculate Cohen’s d in Excel.
Example: Cohen’s d in Excel
Perform the following steps to calculate Cohen’s d in Excel.
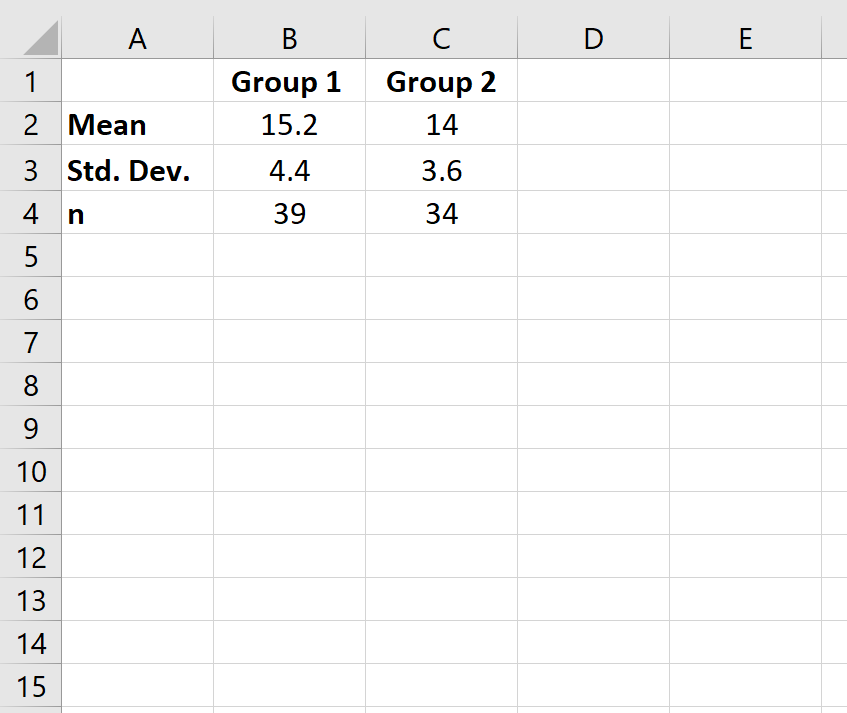
Step 1: Enter the data.
First, we will enter the values for the mean, standard deviation, and sample size (n) for two groups.
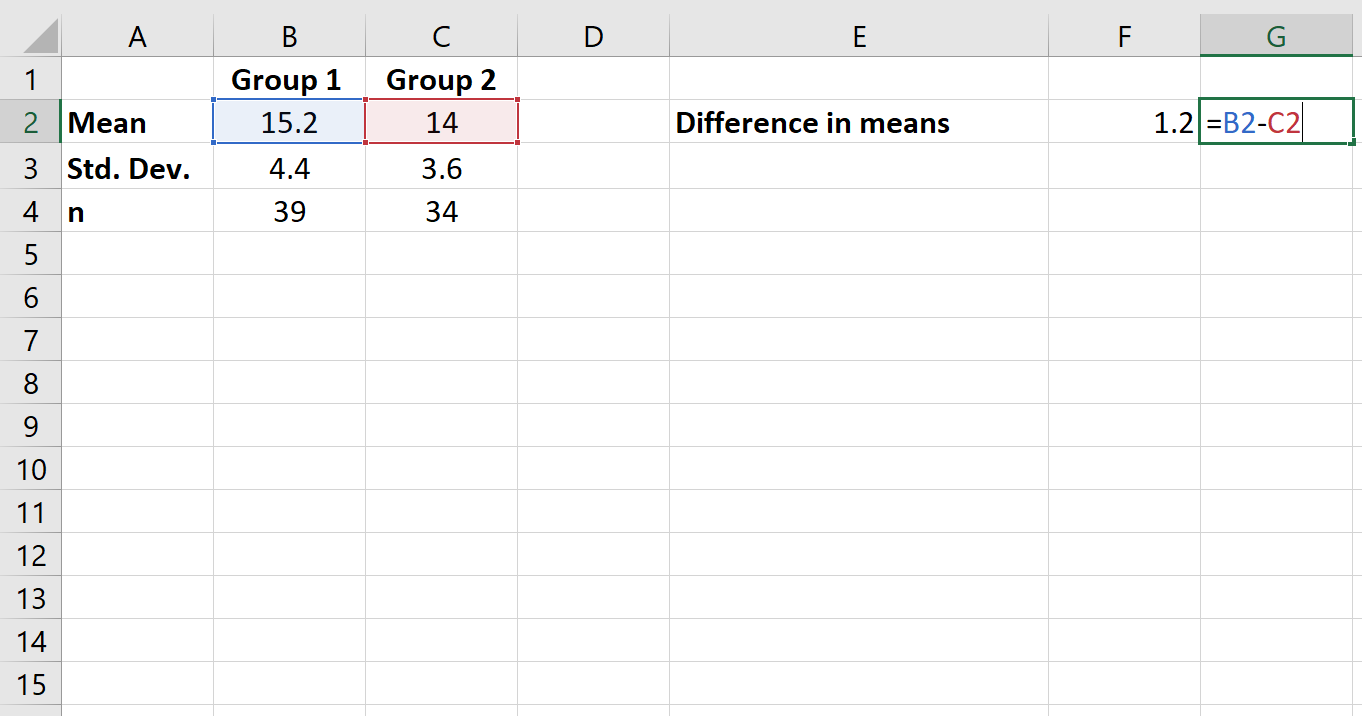
Step 2: Calculate the difference in means.
Next, we will calculate the difference between the group means.
Step 3: Calculate the pooled standard deviation.
Next, we will calculate the pooled standard deviation.

Step 4: Calculate Cohen’s d.
Lastly, we will calculate Cohen’s d.

Cohen’s d turns out to be 0.29851 for this example.
How to Interpret Cohen’s d
As a rule of thumb, here is how to interpret Cohen’s d:
- 0.2 = Small effect size
- 0.5 = Medium effect size
- 0.8 = Large effect size
In our example, an effect size of 0.29851 would likely be considered a small effect size.
This means that even if the difference between the two group means is statistically significantly different, the actual difference between the group means is trivial.