A coefficient of variation, often abbreviated as CV, is a way to measure how spread out values are in a dataset relative to the mean. It is calculated as:
CV = σ / μ
where:
- σ: The standard deviation of dataset
- μ: The mean of dataset
In simple terms, the coefficient of variation is the ratio between the standard deviation and the mean.
It is often used to compare the variation between two different datasets. For example, in finance it is used to compare the mean expected return of an investment relative to the expected standard deviation of the investment.
For example, suppose an investor is considering investing in the following two mutual funds:
Mutual Fund A: mean = 9%, standard deviation = 12.4%
Mutual Fund B: mean = 5%, standard deviation = 8.2%
The investor can calculate the coefficient of variation for each fund:
- CV for Mutual Fund A = 12.4% / 9% = 1.38
- CV for Mutual Fund B = 8.2% / 5% = 1.64
Since Mutual Fund A has a lower coefficient of variation, it offers a better mean return relative to the standard deviation.
The following step-by-step example explains how to calculate the coefficient of variation for the following dataset on a TI-84 calculator:
Dataset: 3, 8, 8, 13, 16, 11
Step 1: Enter the Data
First, we will enter the data values.
Press Stat, then press EDIT. Then enter the values of the dataset in column L1:
Step 2: Find the Coefficient of Variation
Next, press Stat and then scroll over to the right and press CALC.
Then press 1-Var Stats.
In the new screen that appears, press Enter.
Once you press Enter, a list of summary statistics will appear:
From this screen we can observe the values for the mean and the sample standard deviation:
- Mean (x): 9.8333
- Sample standard deviation (Sx): 4.535
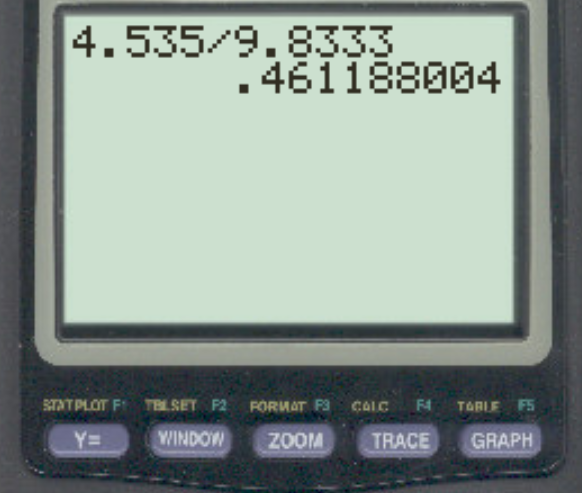
We can then calculate the coefficient of variation as:
The coefficient of variation for this dataset turns out to be 0.4611. In percentage terms, this is equal to 46.11%.
Additional Resources
How to Find a Five Number Summary on a TI-84 Calculator
How to Find Interquartile Range on a TI-84 Calculator


