A coefficient of variation, often abbreviated as CV, is a way to measure how spread out values are in a dataset relative to the mean. It is calculated as:
CV = σ / μ
where:
σ = standard deviation of dataset
μ = mean of dataset
In its simplest terms, the coefficient of variation is simply the ratio between the standard deviation and the mean.
When is the Coefficient of Variation Used?
The coefficient of variation is often used to compare the variation between two different datasets.
In the real world, it’s often used in finance to compare the mean expected return of an investment relative to the expected standard deviation of the investment. This allows investors to compare the risk-return trade-off between investments.
For example, suppose an investor is considering investing in the following two mutual funds:
Mutual Fund A: mean = 7%, standard deviation = 12.4%
Mutual Fund B: mean = 5%, standard deviation = 8.2%
Upon calculating the coefficient of variation for each fund, the investor finds:
CV for Mutual Fund A = 12.4% / 7% = 1.77
CV for Mutual Fund B = 8.2% / 5% = 1.64
Since Mutual Fund B has a lower coefficient of variation, it offers a better mean return relative to the standard deviation.
How to Calculate the Coefficient of Variation in Excel
There is no built-in formula in Excel to calculate the coefficient of variation for a dataset, but fortunately it’s relatively easy to calculate using a couple simple formulas. The following example illustrates how to calculate the coefficient of variation for a given dataset.
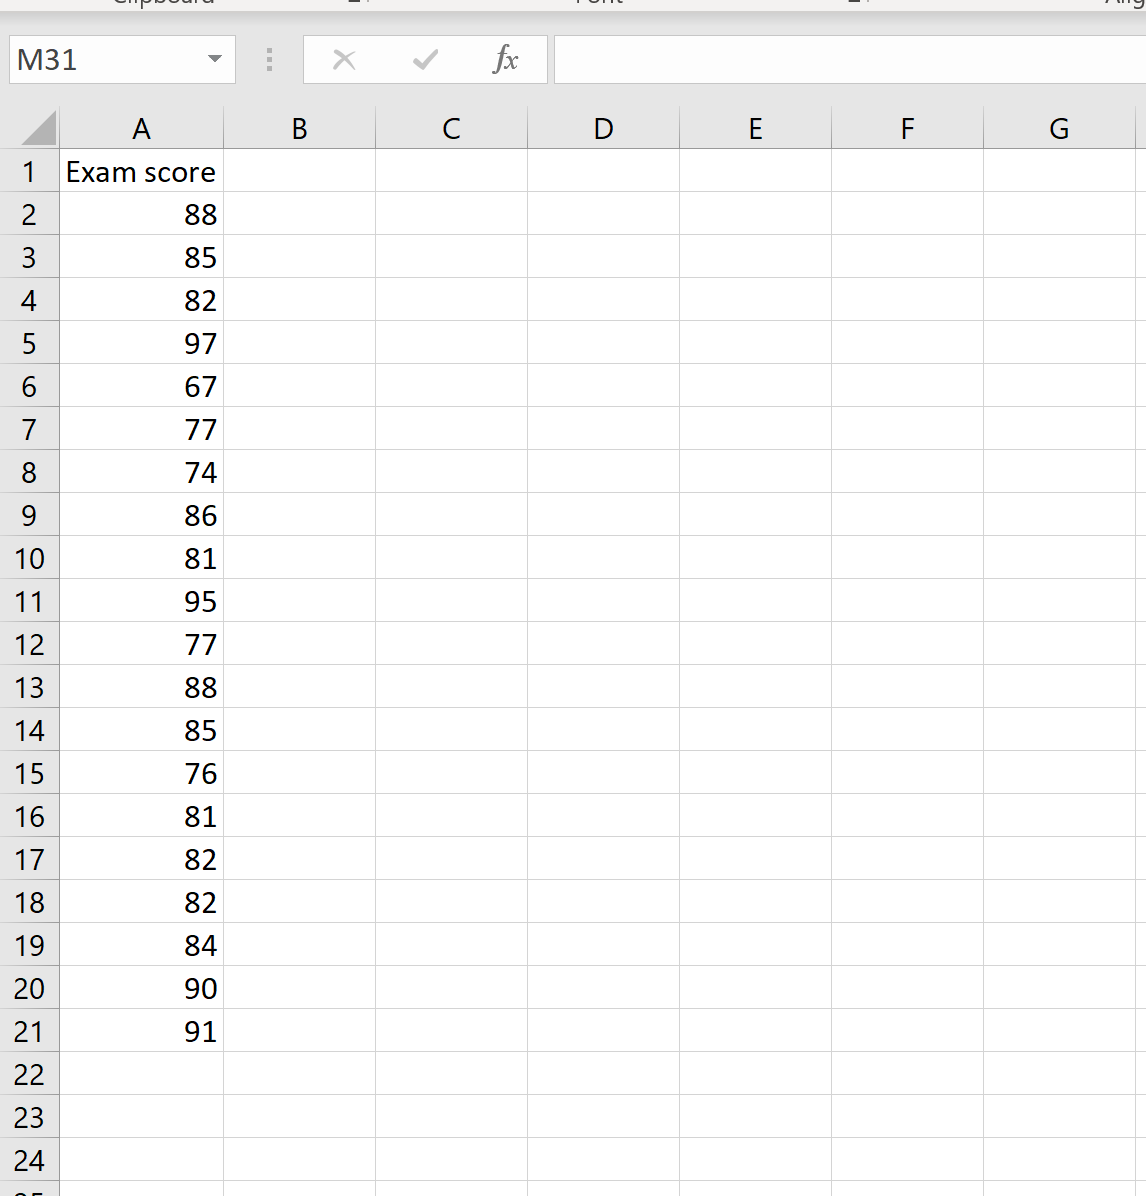
Suppose we have the following dataset that contains the exam scores of 20 students:
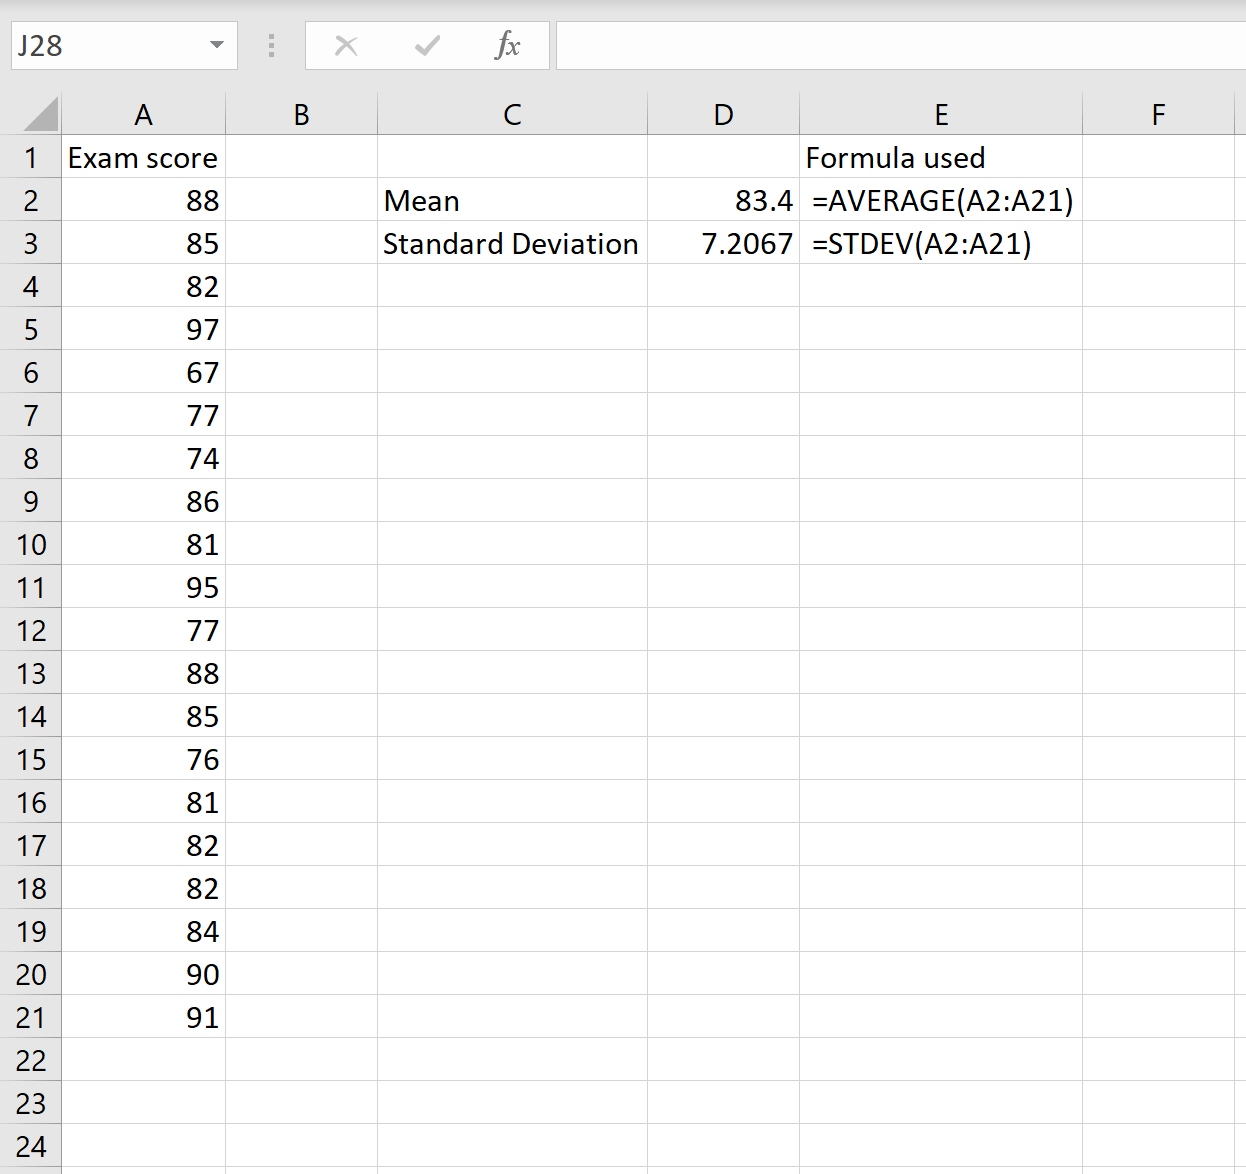
To calculate the coefficient of variation for this dataset, we only need to know two numbers: the mean and the standard deviation. These can be calculated using the following formulas:
Mean: =AVERAGE(A2:A21)
Standard deviation: =STDEV(A2:A21)
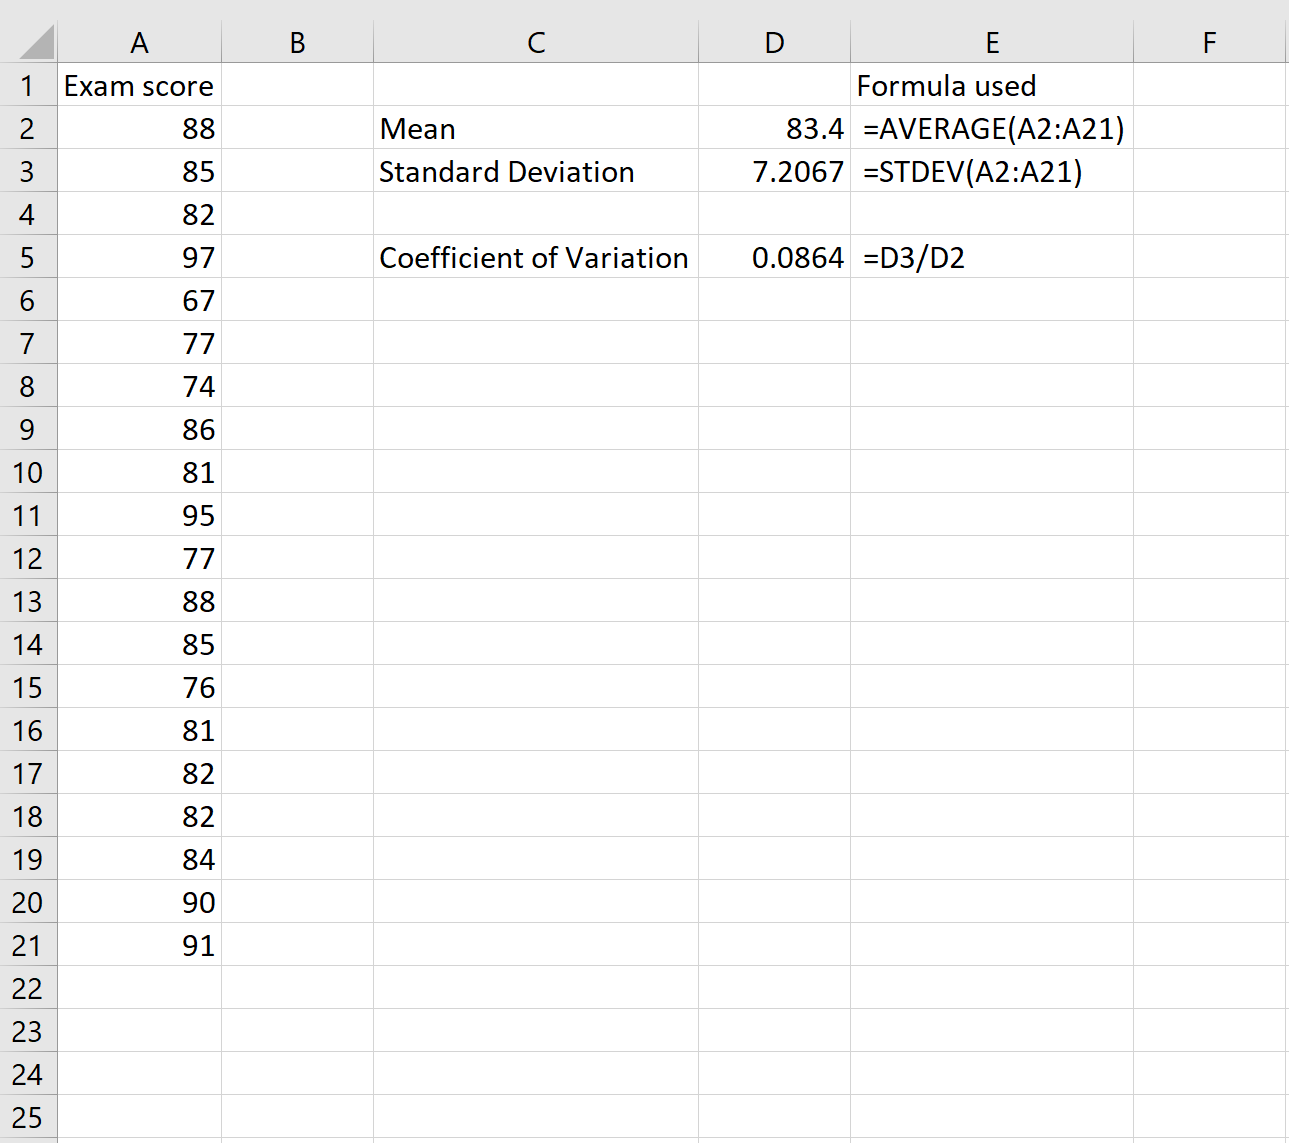
To calculate the coefficient of variation, we then divide the standard deviation by the mean:
The coefficient of variation turns out to be 0.0864.
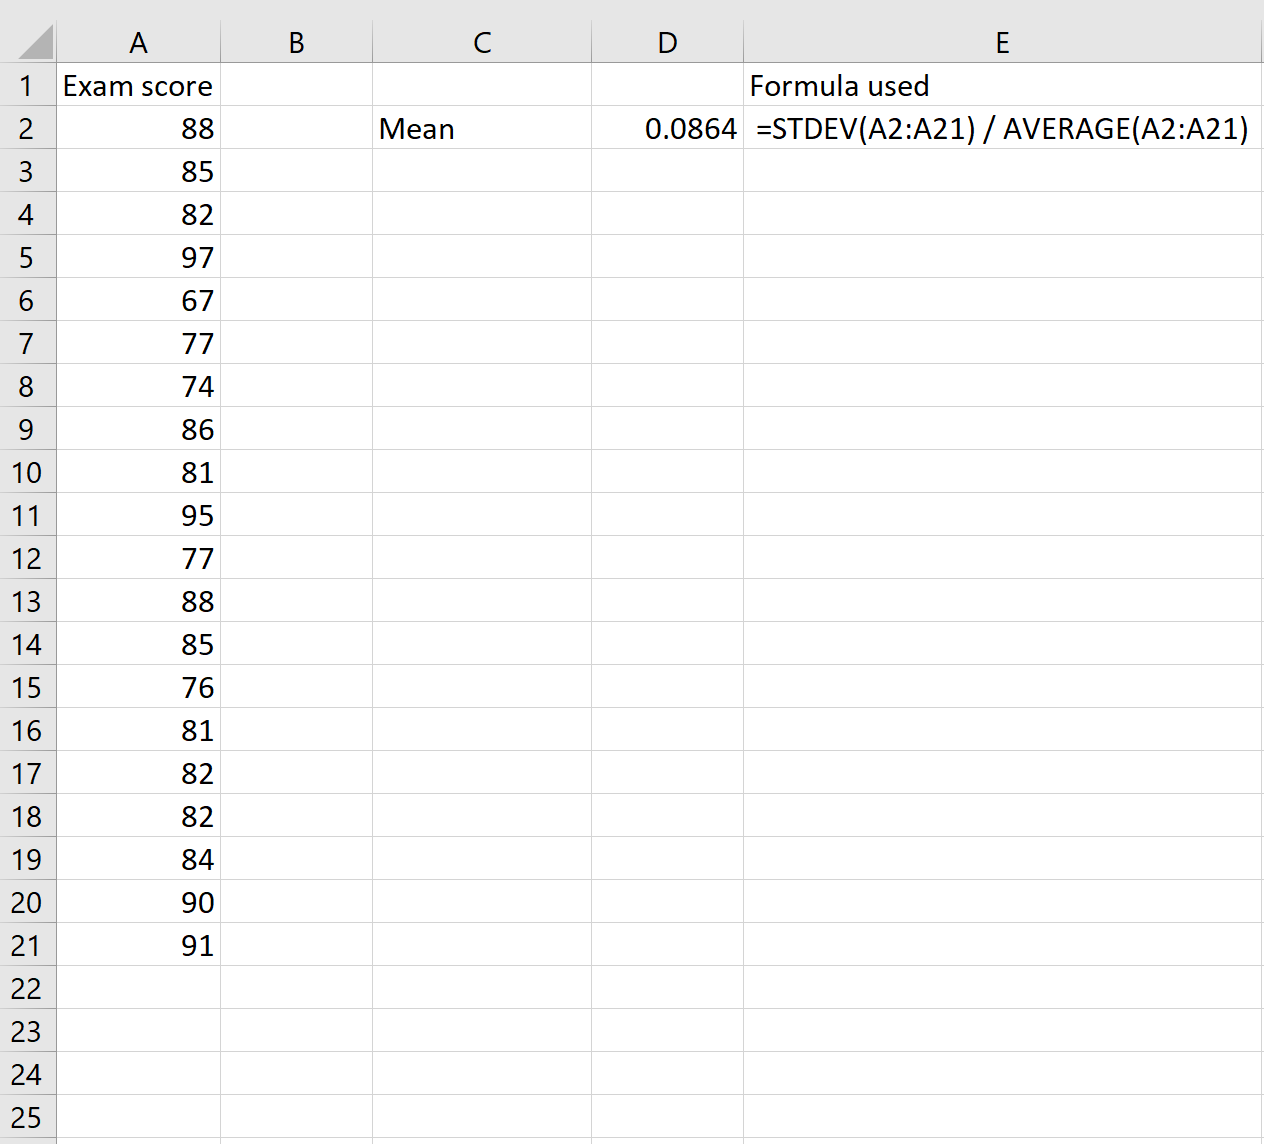
Note that we also could have used just one formula to calculate the CV:
This results in the same CV of 0.0864.


