A frequency distribution table is a table that displays the frequencies of different data classes.
For example, the following frequency distribution table shows the frequency for five different classes:
| Class | Frequency |
|---|---|
| 1 – 10 | 20 |
| 11 – 20 | 21 |
| 21 – 30 | 16 |
| 31 – 40 | 5 |
| 41 – 50 | 4 |
You can find the midpoint of each class by adding the lower class limit and the upper class limit, then dividing by two:
Class midpoint = (lower class limit + upper class limit) / 2
The following table shows how to calculate the midpoint of each class:
| Class | Frequency | Midpoint |
|---|---|---|
| 1 – 10 | 20 | (1+10) / 2 |
| 11 – 20 | 21 | (11+20) / 2 |
| 21 – 30 | 16 | (21+30) / 2 |
| 31 – 40 | 5 | (31+40) / 2 |
| 41 – 50 | 4 | (41+50) / 2 |
Thus, we’re left with the following midpoints:
| Class | Frequency | Midpoint |
|---|---|---|
| 1 – 10 | 20 | 5.5 |
| 11 – 20 | 21 | 15.5 |
| 21 – 30 | 16 | 25.5 |
| 31 – 40 | 5 | 35.5 |
| 41 – 50 | 4 | 45.5 |
When Are Class Midpoints Used?
Class midpoints are often used when you want to create a histogram to visualize the values in a frequency table.
A histogram lists the classes along the x-axis of a graph and uses bars to represent the frequency of each class along the y-axis. Each bar is centered at its class midpoint.
The following histogram provides a visual representation of the data in the previous frequency table:
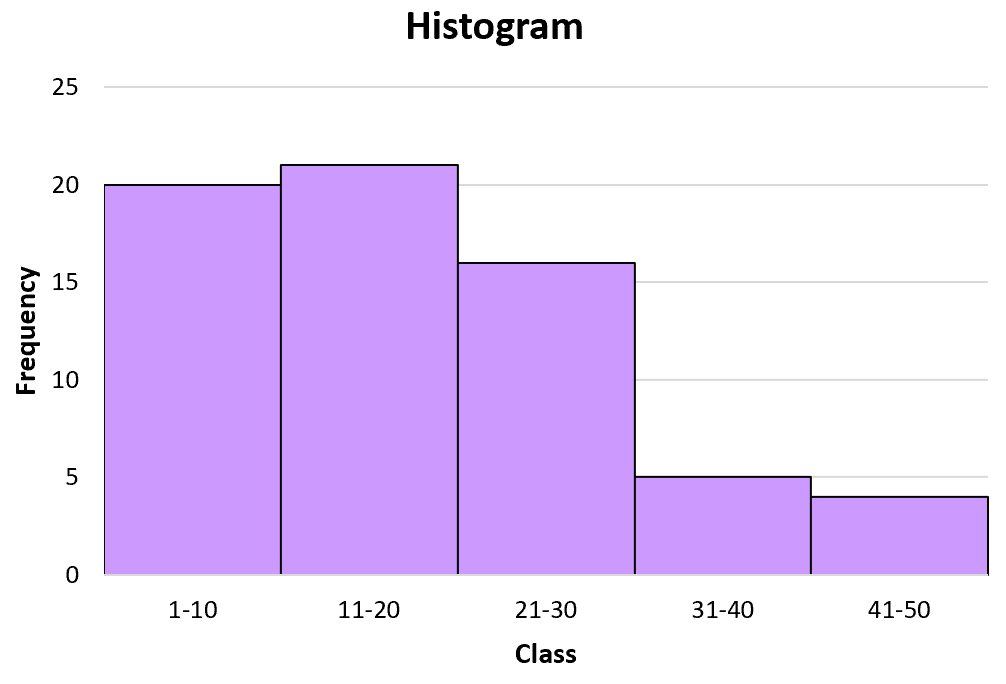
Notice how each bar is centered at its class midpoint:
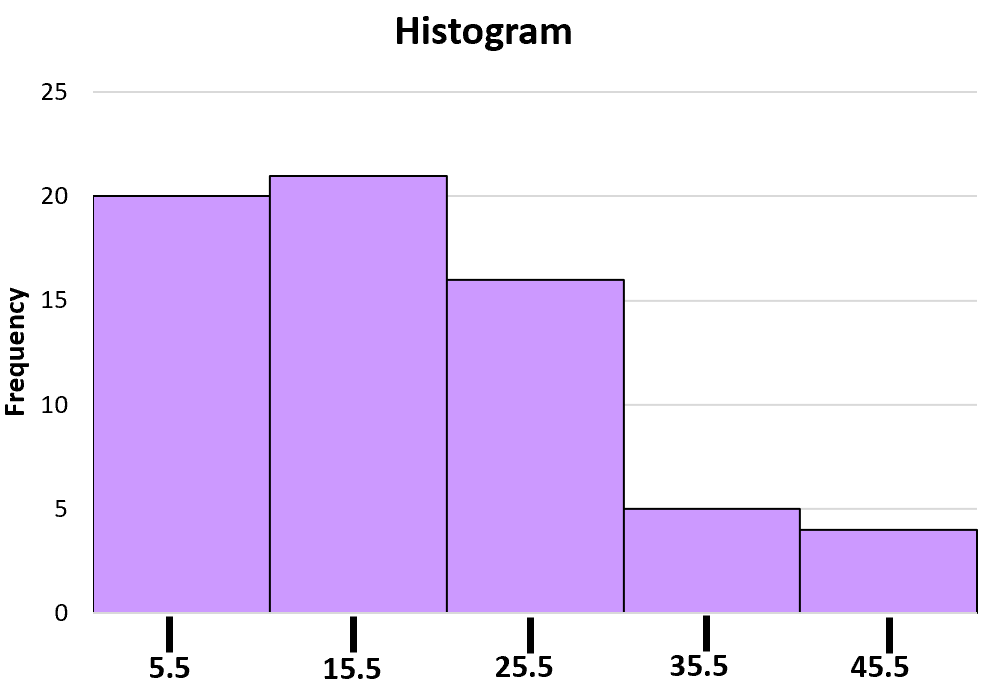
When you’re creating a histogram by hand, it’s especially useful to know the class midpoints so that you know where to place the bars.
However, most statistical softwares are able to automatically center the bars of a histogram around the class midpoints, so you typically won’t have to manually find these midpoints yourself.
Additional Resources
How to Find Class Boundaries
How to Find Class Limits
How to Find Class Intervals
Class Width Calculator
Histogram Generator