A Chow test is used to test whether the coefficients in two different regression models on different datasets are equal.
This test is typically used in the field of econometrics with time series data to determine if there is a structural break in the data at some point.
This tutorial provides a step-by-step example of how to perform a Chow test in R.
Step 1: Create the Data
First, we’ll create some fake data:
#create data
data #view first six rows of data
head(data)

  x  y
1 1  3
2 1  5
3 2  6
4 3 10
5 4 13
6 4 15
Step 2: Visualize the Data
Next, we’ll create a simple scatterplot to visualize the data:
#load ggplot2 visualization package
library(ggplot2)

#create scatterplot
ggplot(data, aes(x = x, y = y)) +
    geom_point(col='steelblue', size=3)
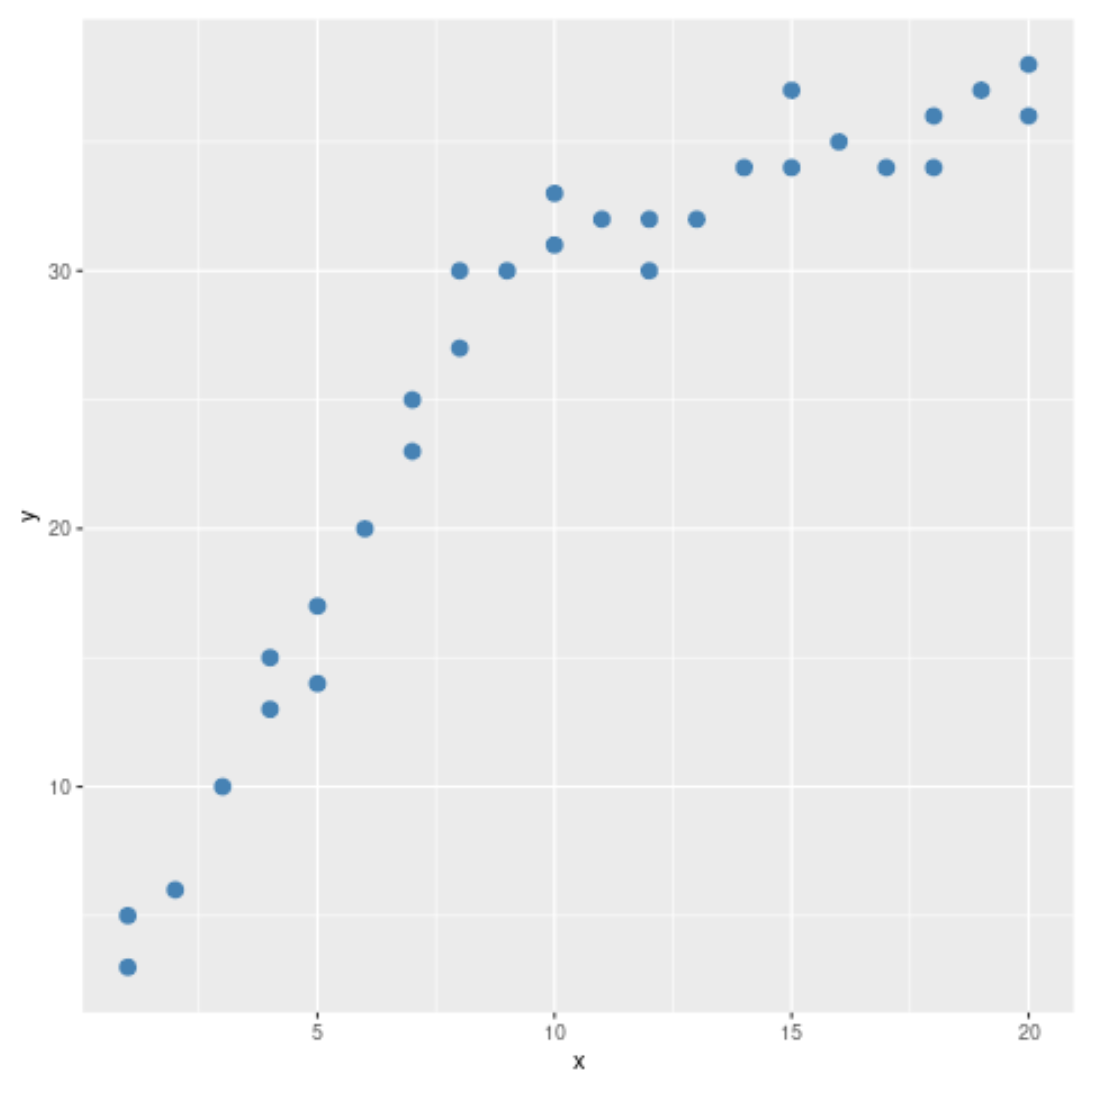
From the scatterplot we can see that the pattern in the data appears to change at x = 10. Thus, we can perform the Chow test to determine if there is a structural break point in the data at x = 10.
Step 3: Perform the Chow Test
We can use the sctest function from the strucchange package to perform a Chow test:
#load strucchange package
library(strucchange)

#perform Chow test
sctest(data$y ~ data$x, type = "Chow", point = 10)

	Chow test

data:  data$y ~ data$x
F = 110.14, p-value = 2.023e-13
From the output of the test we can see:
- F test statistic: 110.14
- p-value: <.0000>
Since the p-value is less than .05, we can reject the null hypothesis of the test. This means we have sufficient evidence to say that a structural break point is present in the data.
In other words, two regression lines can fit the pattern in the data more effectively than a single regression line.