When you conduct a Chi-Square test, you will get a test statistic as a result. To determine if the results of the Chi-Square test are statistically significant, you can compare the test statistic to a Chi-Square critical value. If the test statistic is greater than the Chi-Square critical value, then the results of the test are statistically significant.
The Chi-Square critical value can be found by using a Chi-Square distribution table or by using statistical software.
To find the Chi-Square critical value, you need:
- A significance level (common choices are 0.01, 0.05, and 0.10)
- Degrees of freedom
Using these two values, you can determine the Chi-Square value to be compared with the test statistic.
How to Find the Chi-Square Critical Value in Excel
To find the Chi-Square critical value in Excel, you can use the CHISQ.INV.RT() function, which uses the following syntax:
CHISQ.INV.RT(probability, deg_freedom)
- probability: The significance level to use
- deg_freedom: The degrees of freedom
This function returns the critical value from the Chi-Square distribution based on the significance level and the degrees of freedom provided.
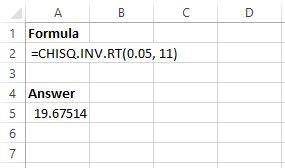
For example, suppose we would like to find the Chi-square critical value for a significance level of 0.05 and degrees of freedom = 11.
In Excel, we can type the following formula: CHISQ.INV.RT(0.05, 11)
This returns the value 19.67514. This is the critical value for a significance level of 0.05 and degrees of freedom = 11.
Note that this also matches the number we would find in the Chi-Square distribution table with α = 0.05, DF (degrees of freedom) = 11.
Cautions on Finding the Chi-Square Critical Value in Excel
Note that the CHISQ.INV.RT() function in Excel will throw an error if any of the following occur:
- If any argument is non-numeric.
- If the value for probability is less than zero or greater than 1.
- If the value for deg_freedom is less than 1.


