Often you may want to change the font sizes of various elements on a Matplotlib plot. Fortunately this is easy to do using the following code:
import matplotlib.pyplot as plt

plt.rc('font', size=10) #controls default text size
plt.rc('axes', titlesize=10) #fontsize of the title
plt.rc('axes', labelsize=10) #fontsize of the x and y labels
plt.rc('xtick', labelsize=10) #fontsize of the x tick labels
plt.rc('ytick', labelsize=10) #fontsize of the y tick labels
plt.rc('legend', fontsize=10) #fontsize of the legend
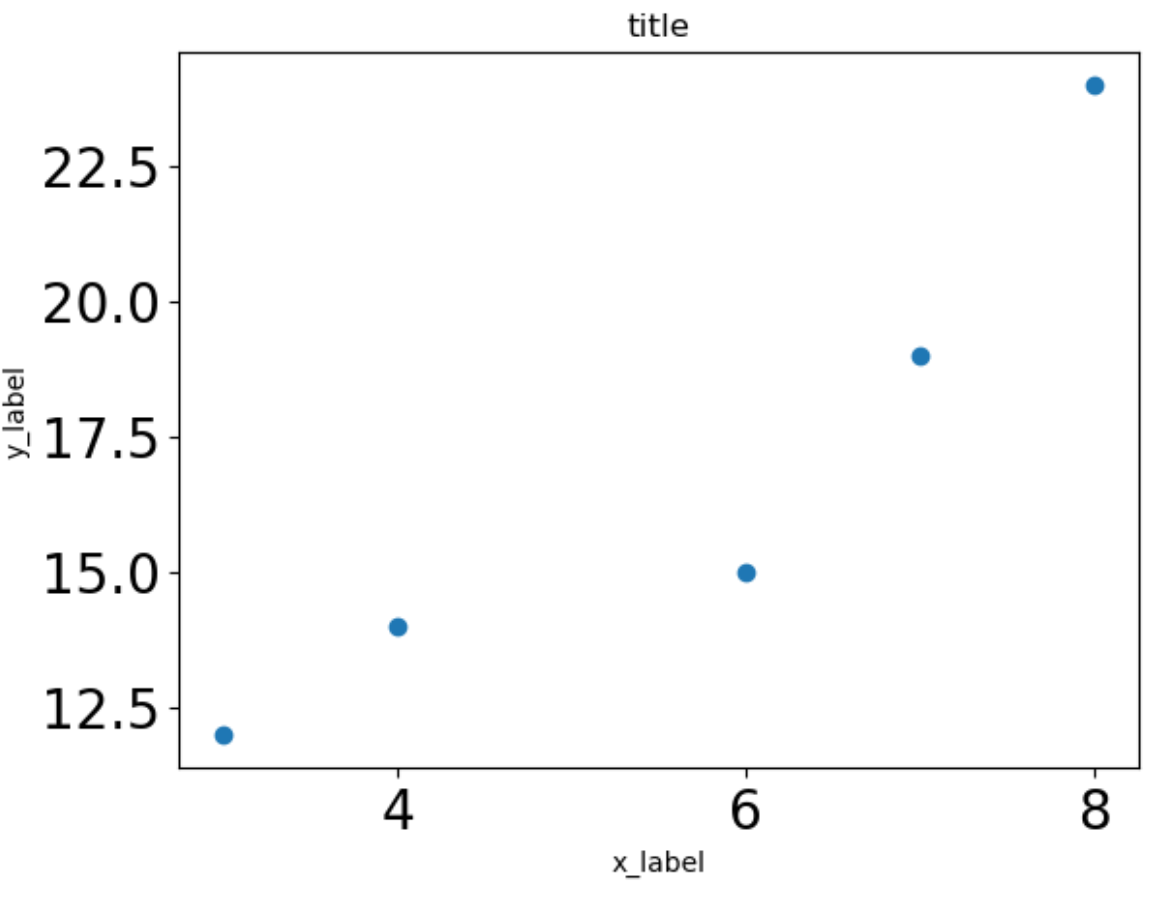
The following examples illustrates how to change the font sizes of various elements in the following matplotlib scatterplot:
import matplotlib.pyplot as plt

x = [3, 4, 6, 7, 8]
y = [12, 14, 15, 19, 24]

plt.scatter(x, y)
plt.title('title')
plt.xlabel('x_label')
plt.ylabel('y_label')
plt.show()
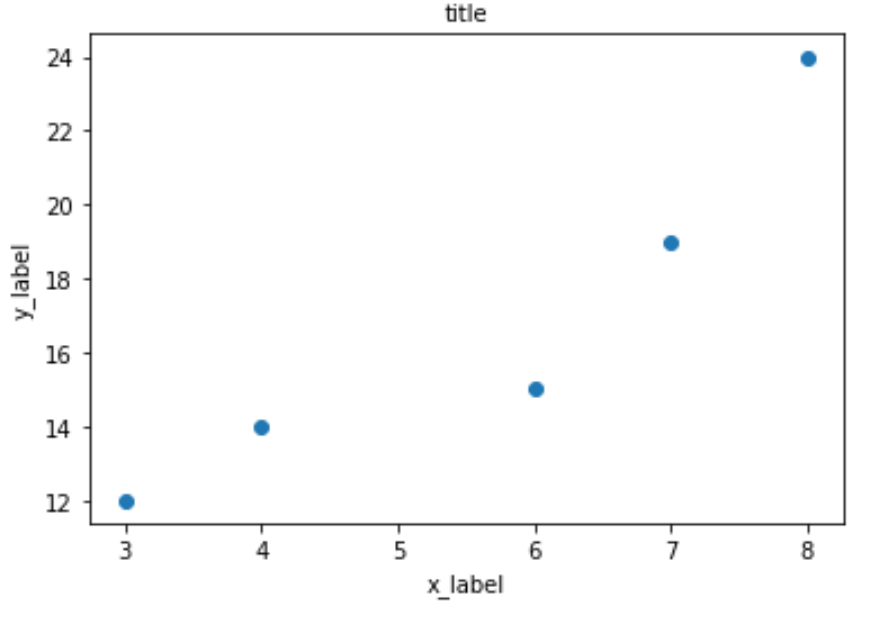
Note: The default font size for all elements is 10.
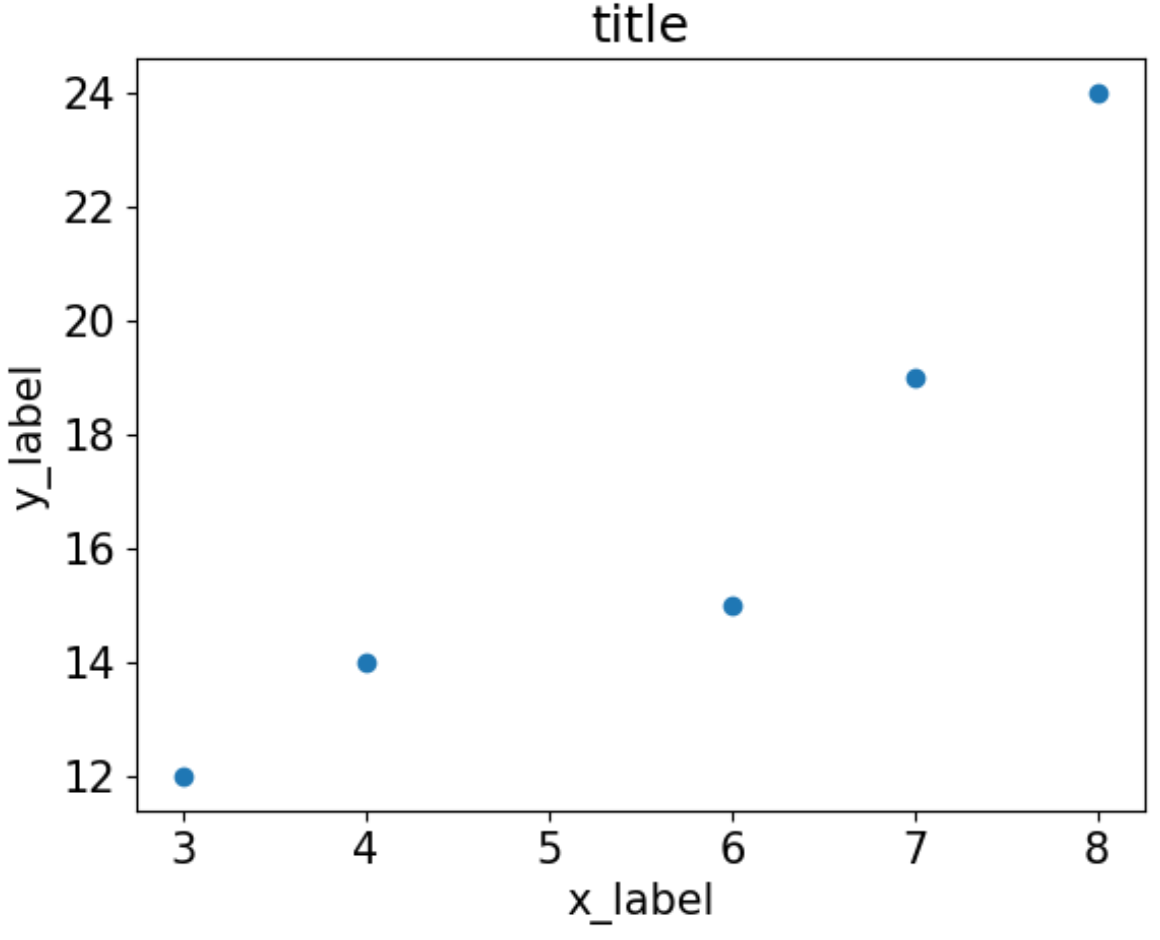
Example 1: Change the Font Size of All Elements
The following code shows how to change the font size of every element in the plot:
#set font of all elements to size 15
plt.rc('font', size=15)

#create plot
plt.scatter(x, y)
plt.title('title')
plt.xlabel('x_label')
plt.ylabel('y_label')
plt.show()
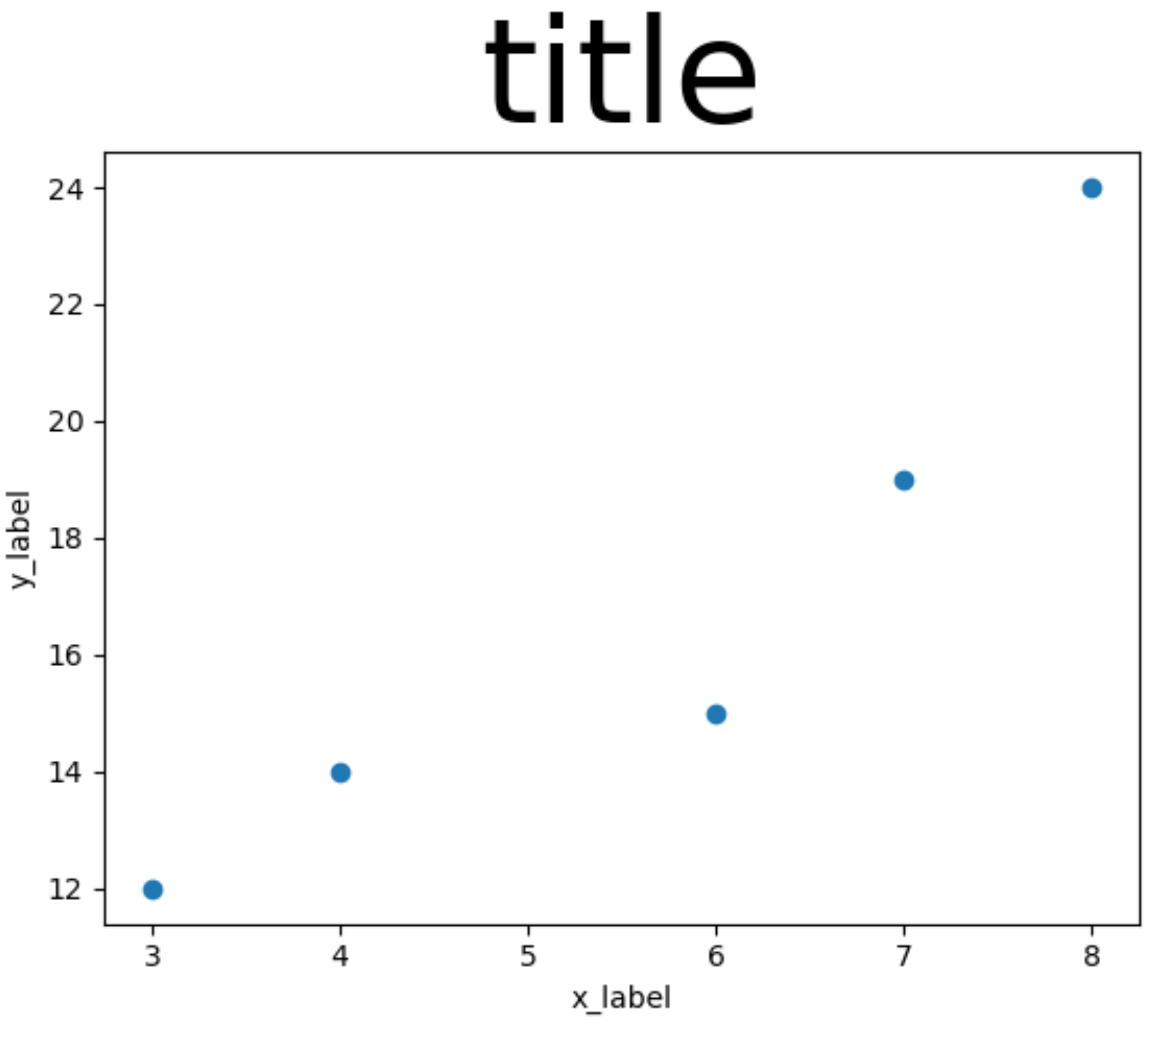
Example 2: Change the Font Size of the Title
The following code shows how to change the font size of the title of the plot:
#set title font to size 50
plt.rc('axes', titlesize=50)

#create plot
plt.scatter(x, y)
plt.title('title')
plt.xlabel('x_label')
plt.ylabel('y_label')
plt.show()
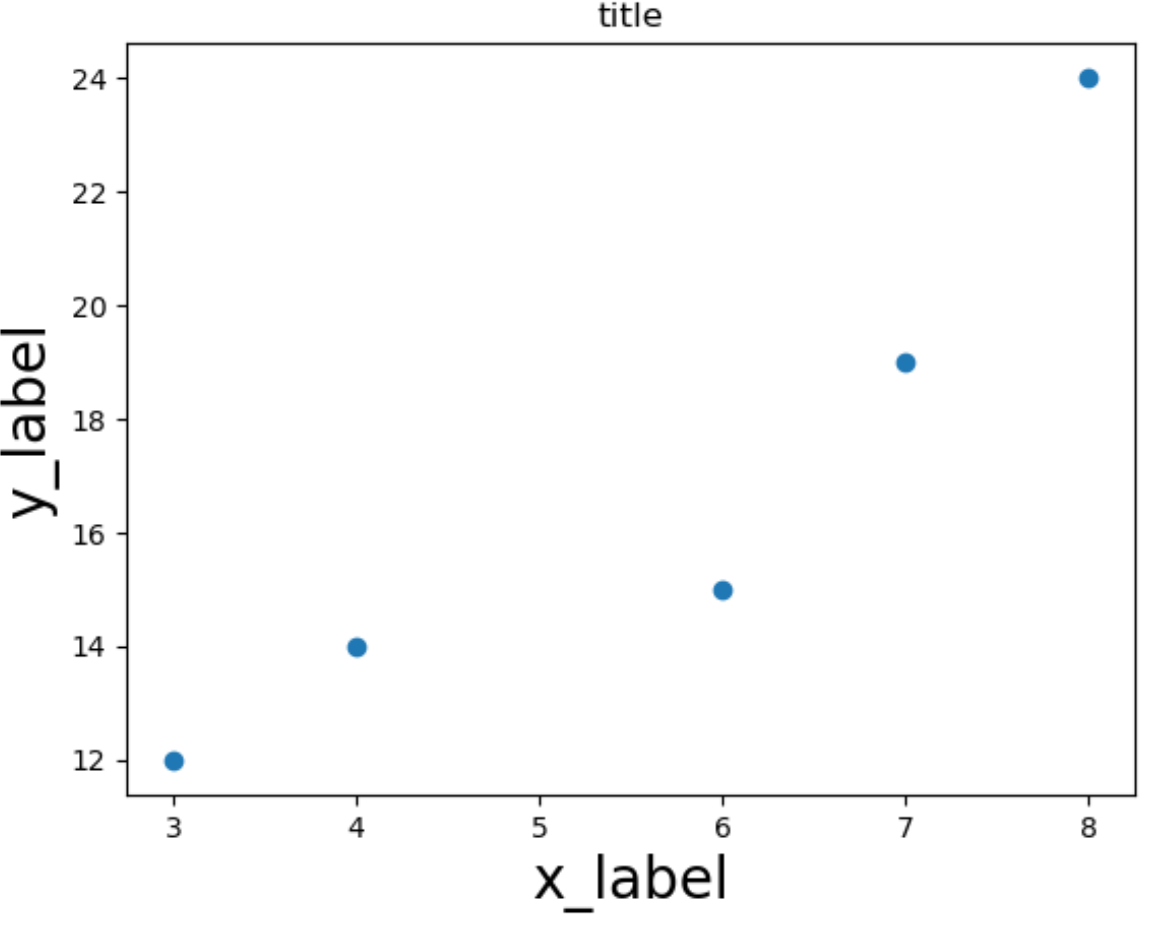
Example 3: Change the Font Size of the Axes Labels
The following code shows how to change the font size of the axes labels of the plot:
#set axes labels font to size 20
plt.rc('axes', labelsize=20)

#create plot
plt.scatter(x, y)
plt.title('title')
plt.xlabel('x_label')
plt.ylabel('y_label')
plt.show()
Example 4: Change the Font Size of the Tick Labels
The following code shows how to change the font size of the tick labels of the plot:
#set tick labels font to size 20
plt.rc('xtick', labelsize=20)
plt.rc('ytick', labelsize=20)

#create plot
plt.scatter(x, y)
plt.title('title')
plt.xlabel('x_label')
plt.ylabel('y_label')
plt.show()
Bonus: Restore the Default Font Sizes
You can use the following code to restore all fonts to their default size at any point:
plt.rcParams.update(plt.rcParamsDefault)
You can find more Matplotlib tutorials here.