The central limit theorem states that the sampling distribution of a sample mean is approximately normal if the sample size is large enough, even if the population distribution is not normal.
The central limit theorem also states that the sampling distribution will have the following properties:
1. The mean of the sampling distribution will be equal to the mean of the population distribution:
x = μ
2. The standard deviation of the sampling distribution will be equal to the standard deviation of the population divided by the sample size:
s = σ / √n
In this tutorial, we explain how to apply the central limit theorem in Excel to a given distribution.
Applying the Central Limit Theorem in Excel
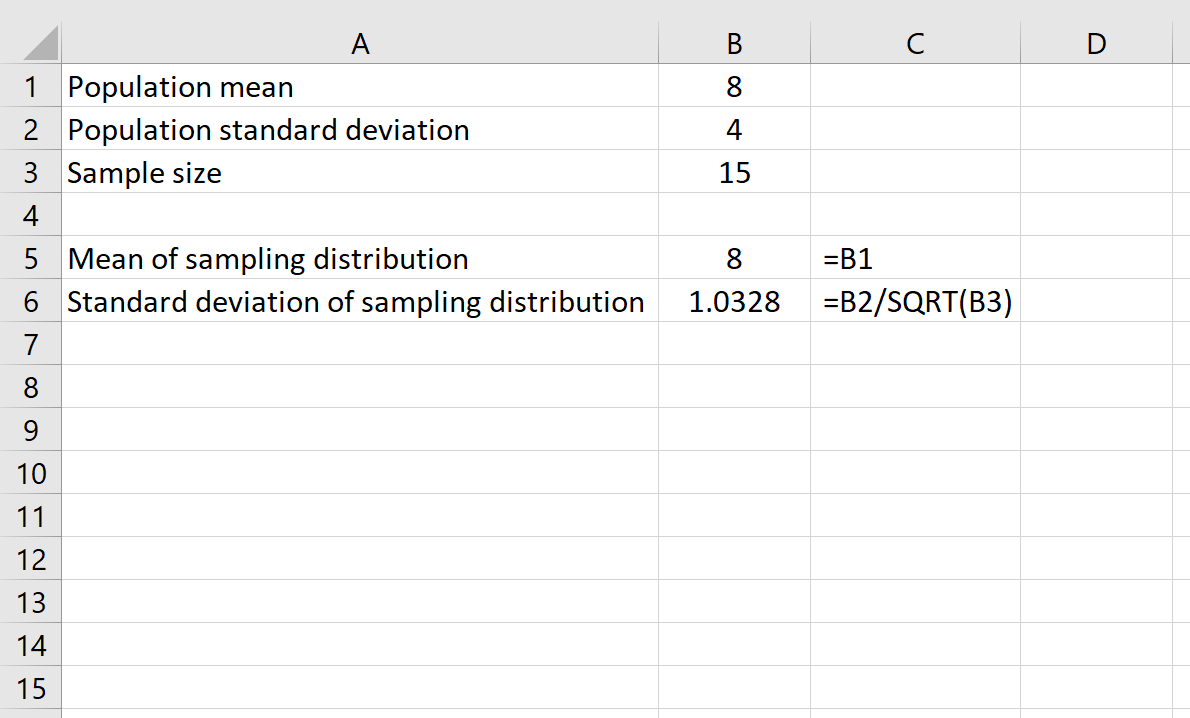
Suppose we have a distribution with a mean of 8 and a standard deviation of 4. We can use the following formulas in Excel to find both the mean and the standard deviation of the sampling distribution with a sample size of 15:
The mean of the sampling distribution is simply equal to the mean of the population distribution, which is 8.
The standard deviation of the sampling distribution is equal to the population standard deviation divided by the sample size, which is: 4 /√15 = 1.0328.
We can also use the central limit theorem to answer questions about probabilities. For example, if a given population has a mean of 8 and a standard deviation of 4, what is the probability that a given sample of size 15 has a mean less than or equal to 7?
To answer this question, we can use the NORM.DIST() function in Excel, which uses the following syntax:
NORM.DIST(x, mean, standard_dev, cumulative)
where:
- x: the sample mean you’d like to test
- mean: expected mean of sampling distribution
- standard_dev: expected standard deviation of sampling distribution
- cumulative: TRUE returns the value of the normal CDF; FALSE returns the value of the normal PDF. In our case, we will always use TRUE.
This function will return the probability that the sample mean is less than or equal to a certain value.
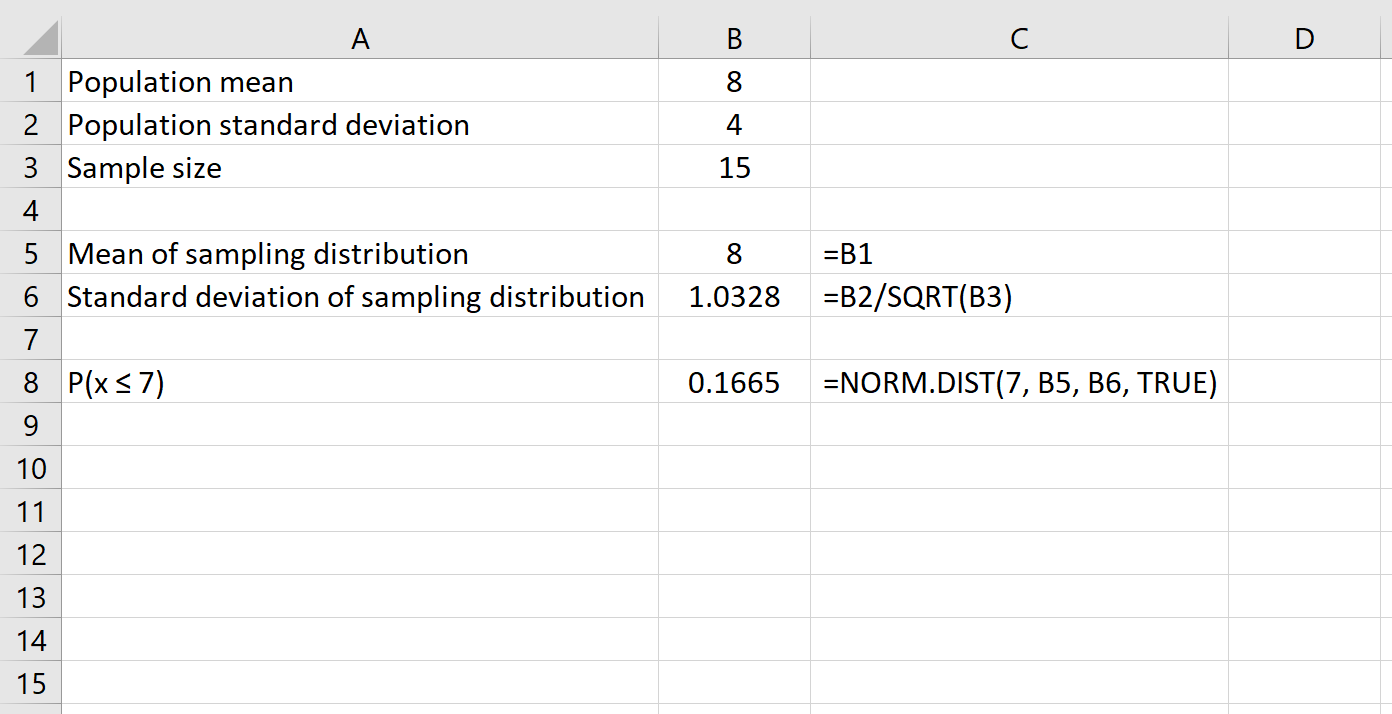
Here is the formula we would use in this example:
This tells us that for a population with a mean of 8 and a standard deviation of 4, the probability that a given sample of size 15 has a mean less than or equal to 7 is 0.1665.
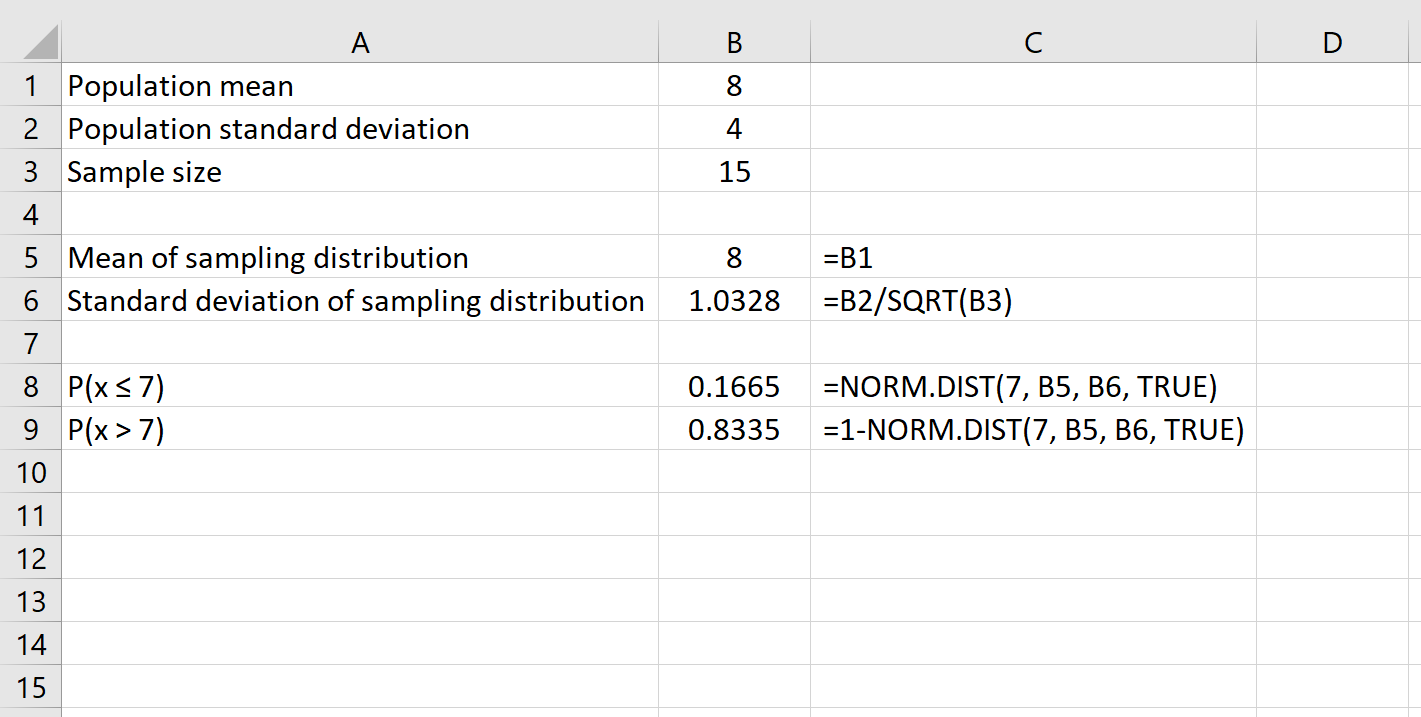
We can also find the probability that a given sample size has a mean greater than a certain number by simply using the formula 1 – NORM.DIST().
For example, the following formula shows how to find the probability that a given sample size of 15 has a mean greater than 7:
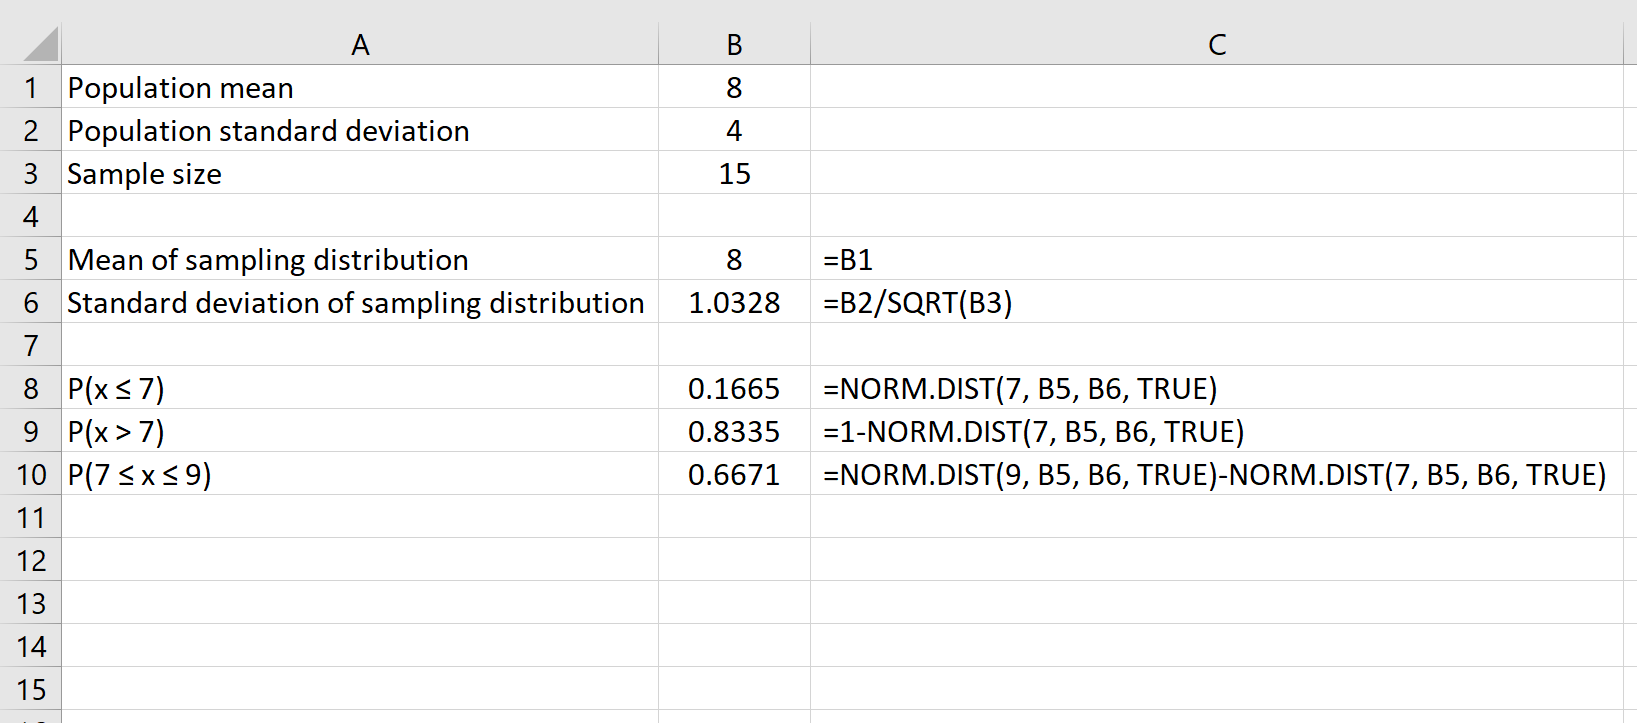
Lastly, we can find the probability that a given sample size will have a mean between two numbers by using the formula NORM.DIST(larger number) – NORM.DIST(smaller number).
For example, the following formula shows how to find the probability that a given sample size of 15 has a mean between 7 and 9:
Additional Resources
Central Limit Theorem Calculator
How to Apply the Empirical Rule in Excel
How to Make a Bell Curve in Excel


