You can use the following basic syntax to produce bold font in R plots:
substitute(paste(bold('this text is bold')))
The following examples show how to use this syntax in practice.
Example 1: Bold Font on Axis Labels of Plot
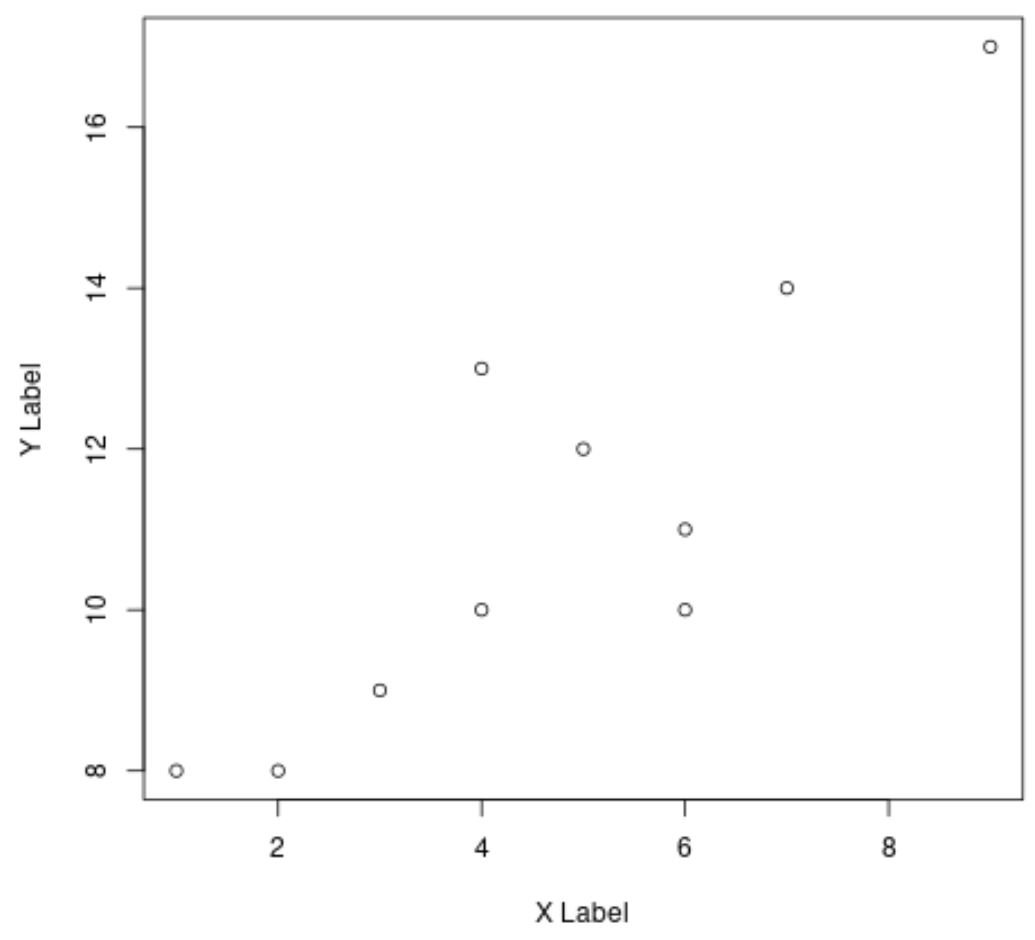
The following code shows how to create a scatter plot in R using normal font for both axis labels:
#define data
x #create scatter plot with normal font for axis labels
plot(x, y, xlab='X Label', ylab='Y Label')
And the following code shows how to specify bold font for the x-axis and y-axis labels of a plot:
#define data
x #create scatterplot with axes labels in bold
plot(x, y, xlab = substitute(paste(bold('X Label'))),
           ylab = substitute(paste(bold('Y Label'))))
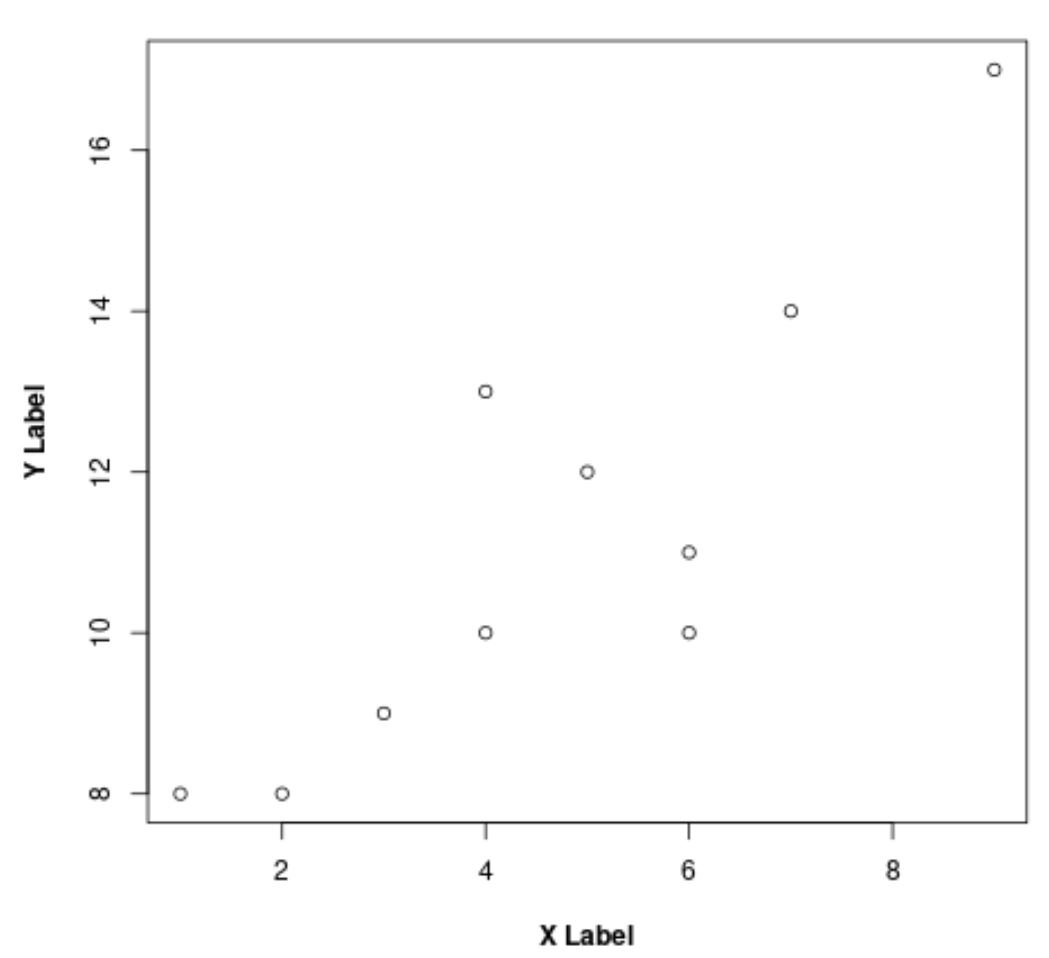
Notice how the labels for both axes are now bold.
Example 2: Bold Font with Text in Plot
The following code shows how to include bold font for a text element inside of a plot:
#define data
x #create scatterplot
plot(x, y)

#add normal text at location x=3, y=14
text(3, 14, 'This is some normal text')

#add bold text at location x=3, y=16
text(3, 16, substitute(paste(bold('This is some bold text'))))
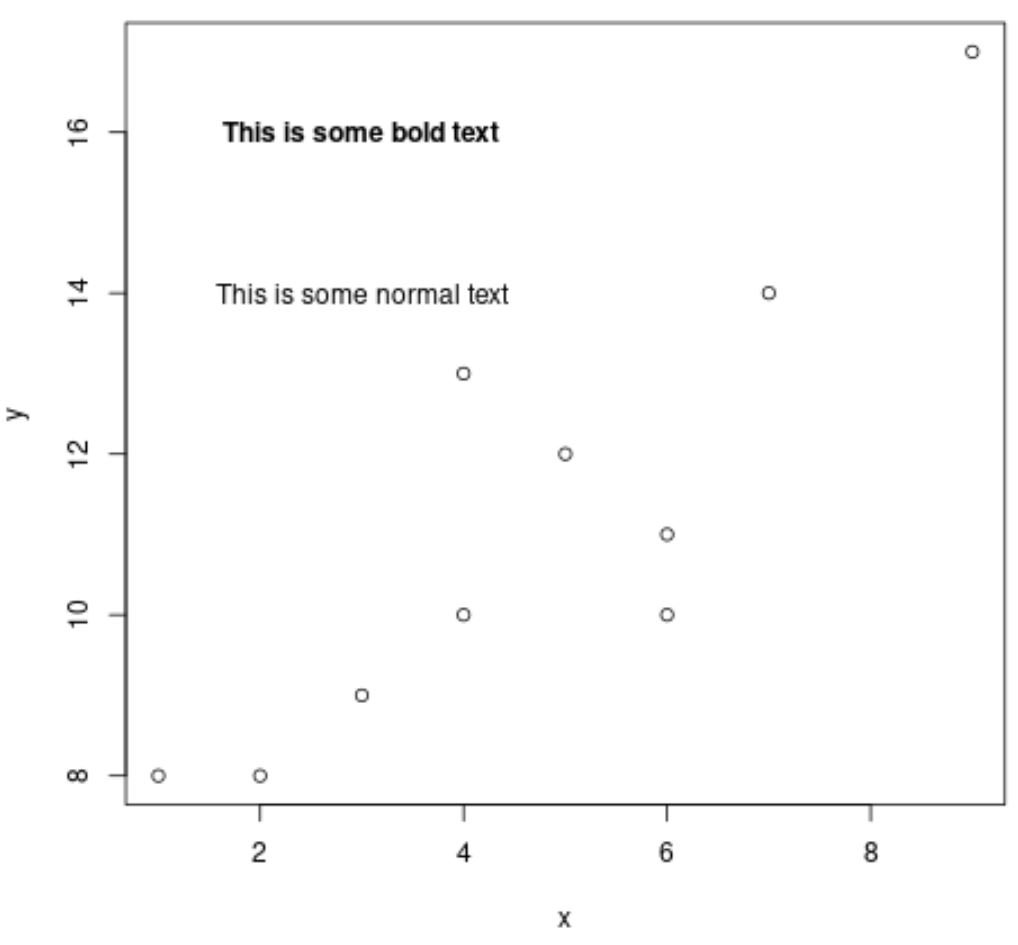
Notice the difference between the bold font and the normal font.
Additional Resources
The following tutorials explain how to perform other common functions in R:
How to Use Italic Font in R
How to Add Superscripts & Subscripts to Plots in R
How to Change Font Size in ggplot2