Autocorrelation measures the degree of similarity between a time series and a lagged version of itself over successive time intervals.
It’s also sometimes referred to as “serial correlation” or “lagged correlation” since it measures the relationship between a variable’s current values and its historical values.
When the autocorrelation in a time series is high, it becomes easy to predict future values by simply referring to past values.
Autocorrelation in Excel
There is no built-in function to calculate autocorrelation in Excel, but we can use a single formula to calculate the autocorrelation for a time series for a given lag value.
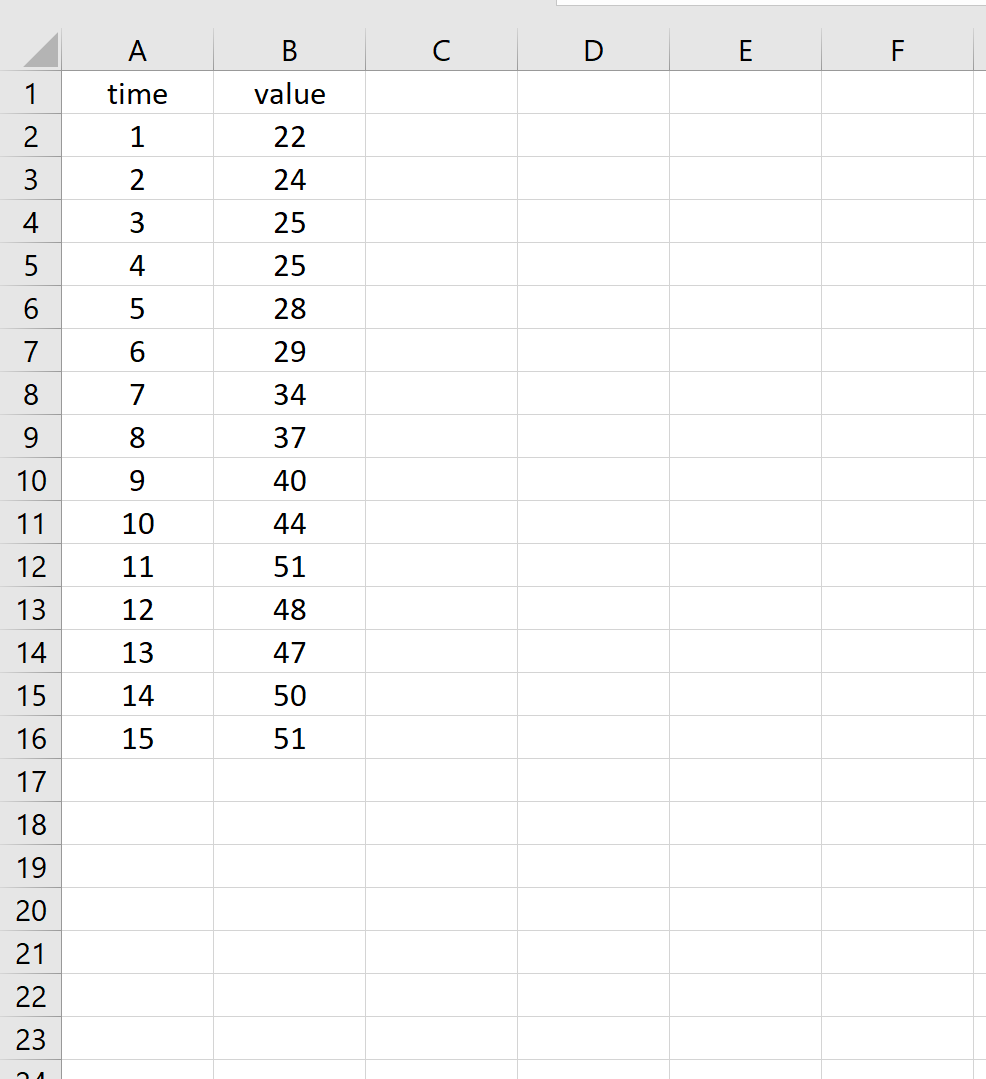
For example, suppose we have the following time series that shows the value of a certain variable during 15 different time periods:
We can use the following formula to calculate the autocorrelation at lag k =2.
=(SUMPRODUCT(B2:B14-AVERAGE(B2:B16), B4:B16-AVERAGE(B2:B16))/COUNT(B2:B16))/VAR.P(B2:B16)
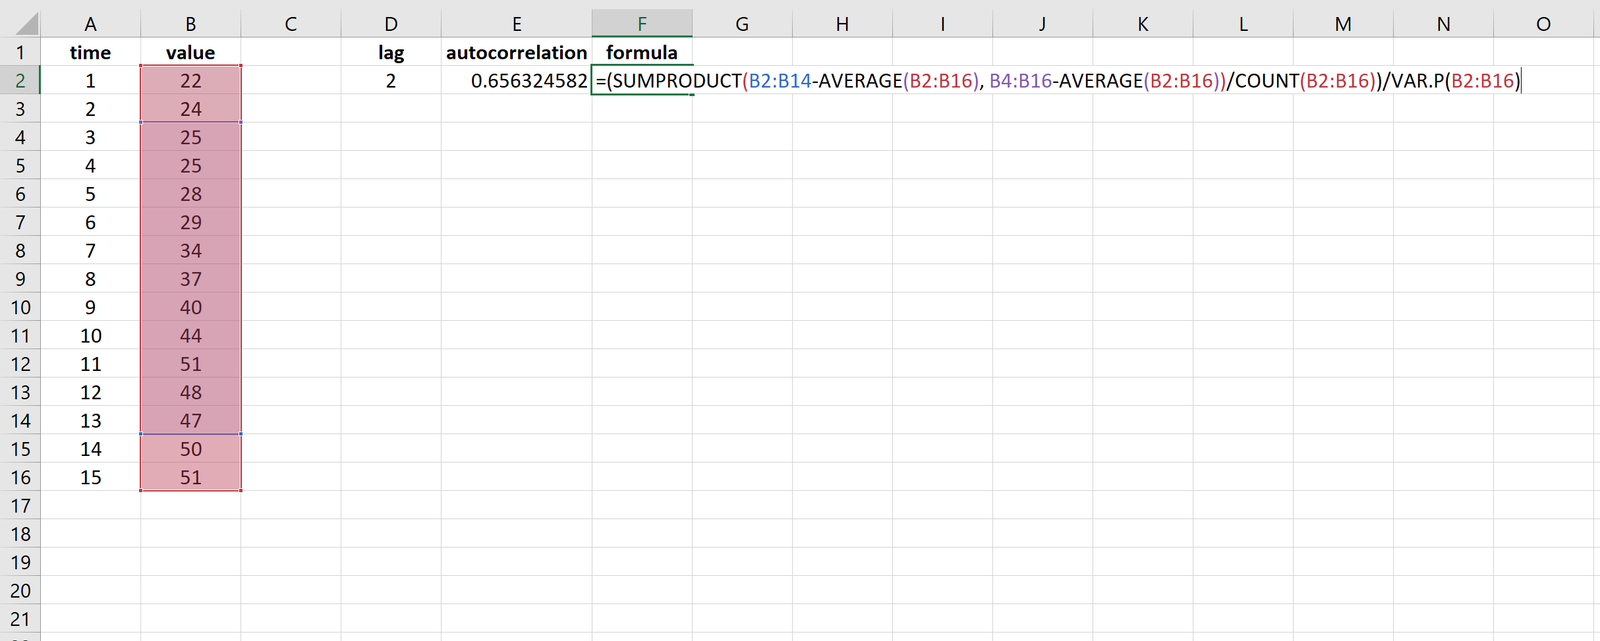
This results in a value of 0.656325. This is the autocorrelation at lag k = 2.
We can calculate the autocorrelation at lag k = 3 by changing the range of values in the formula:
=(SUMPRODUCT(B2:B13-AVERAGE(B2:B16), B5:B16-AVERAGE(B2:B16))/COUNT(B2:B16))/VAR.P(B2:B16)
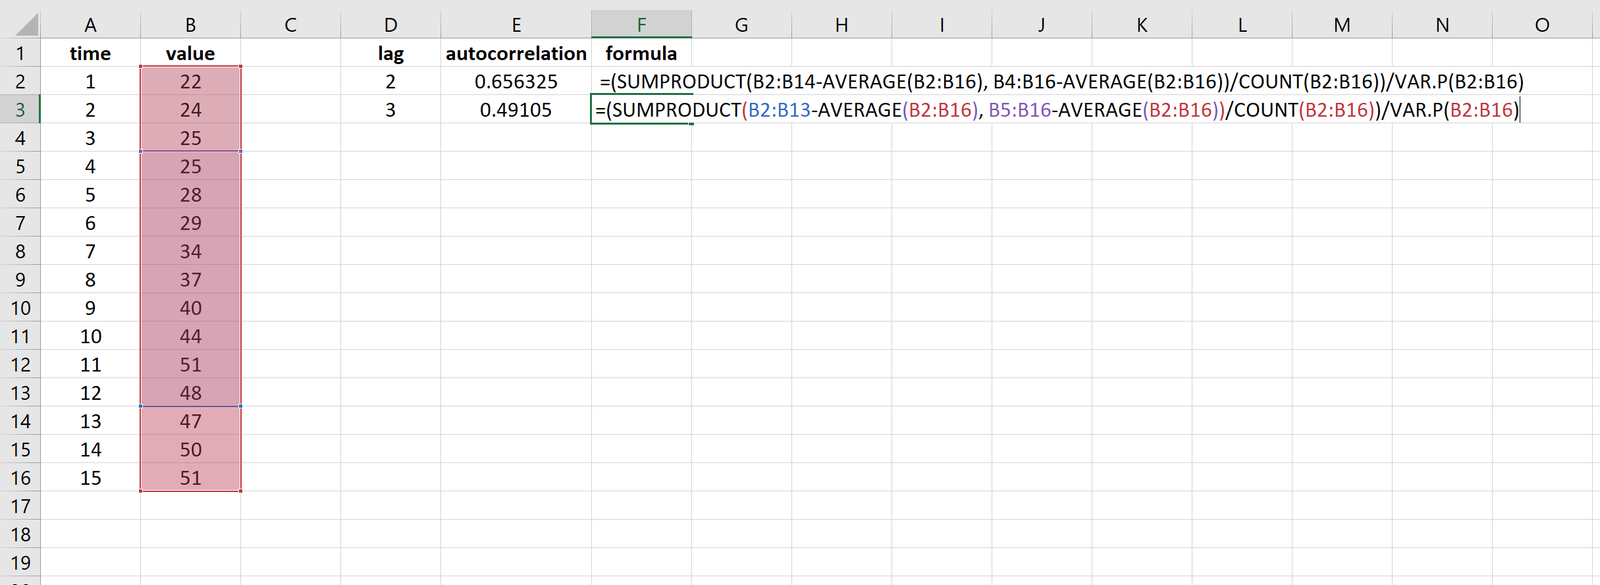
This results in a value of 0.49105. This is the autocorrelation at lag k = 3.
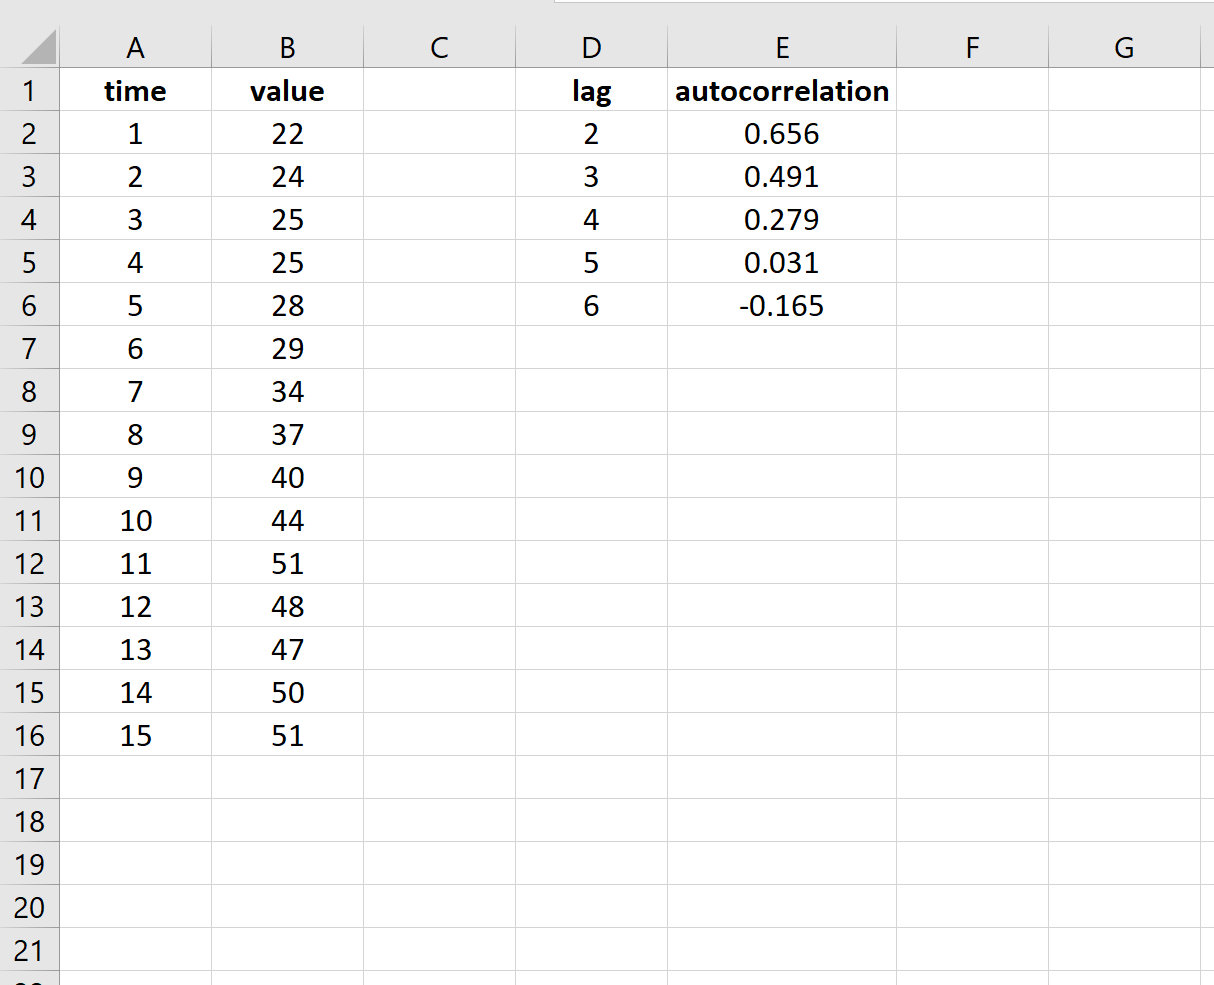
We can find the autocorrelation at each lag by using a similar formula. You’ll notice that the higher the lag, the lower the autocorrelation. This is typical of an autoregressive time series process.
You can find more Excel time series tutorials on this page.