When we would like to calculate the correlation between two continuous variables, we typically use the Pearson correlation coefficient.
However, when we would like to calculate the correlation between a continuous variable and a categorical variable, we can use something known as point biserial correlation.
Point biserial correlation is used to calculate the correlation between a binary categorical variable (a variable that can only take on two values) and a continuous variable and has the following properties:
- Point biserial correlation can range between -1 and 1.
- For each group created by the binary variable, it is assumed that the continuous variable is normally distributed with equal variances.
- For each group created by the binary variable, it is assumed that there are no extreme outliers.
The following example shows how to calculate a point biserial correlation in practice.
Example: Calculating a Point Biserial Correlation
Suppose a college professor would like to determine if there is a correlation between gender and score on particular aptitude exam.
He collects the following data on 12 males and 12 females in his class:
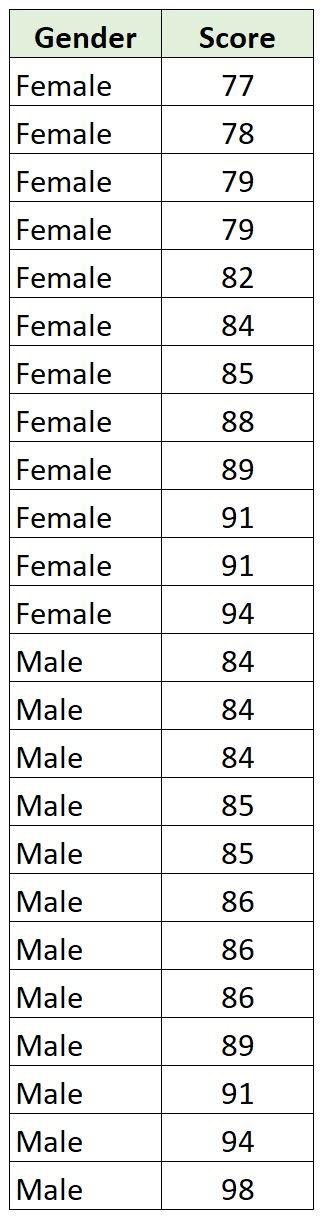
Since gender is a categorical variable and score is a continuous variable, it makes sense to calculate a point-biserial correlation between the two variables.
The professor can use any statistical software (including Excel, R, Python, SPSS, Stata) to calculate the point-biserial correlation between the two variables.
The following code shows how to calculate the point-biserial correlation in R, using the value 0 to represent females and 1 to represent males for the gender variable:
#define values for gender
gender #define values for score
score #calculate point-biserial correlation
cor.test(gender, score)

	Pearson's product-moment correlation

data:  gender and score
t = 1.3739, df = 22, p-value = 0.1833
alternative hypothesis: true correlation is not equal to 0
95 percent confidence interval:
 -0.1379386  0.6147832
sample estimates:
      cor
0.2810996
From the output we can see that the point biserial correlation coefficient is 0.281 and the corresponding p-value is 0.1833.
Since the correlation coefficient is positive, it tells us that there is a positive correlation between gender and score.
Since we coded the males as 1 and females as 0, this indicates that scores tend to be higher for males (i.e. scores tend to increase as gender “increases” from 0 to 1)
However, since the p-value is not less than .05, this correlation coefficient is not statistically significant.
Additional Resources
The following tutorials explain how to calculate point biserial correlation using different statistical software:
How to Calculate Point-Biserial Correlation in Excel
How to Calculate Point-Biserial Correlation in R
How to Calculate Point-Biserial Correlation in Python