In most statistics courses, students learn about linear relationships between variables.
These are relationships where an increase in one variable is associated with a predictable increase in another variable.
One example of this might be minutes played in a basketball game vs. total points scored:
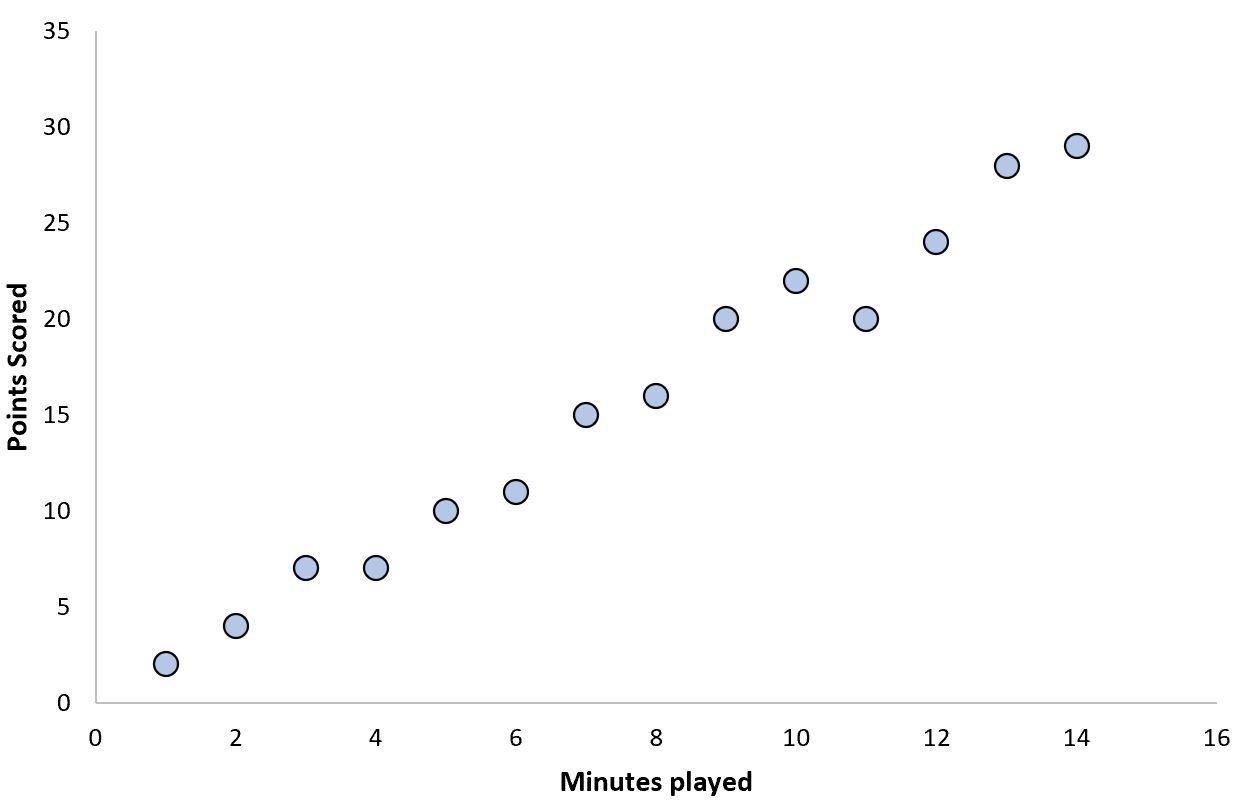
Players who play more minutes tend to score more points.
However, there can also exist nonlinear relationships between variables and these appear all the time in the real world.
This tutorial provides five examples of nonlinear relationships between variables in the real world.
Example 1: Quadratic Relationships
One of the most common nonlinear relationships in the real world is a quadratic relationship between variables.
When plotted on a scatterplot, this relationship typically exhibits a “U” shape.
One example might be total working hours per week vs. overall happiness:
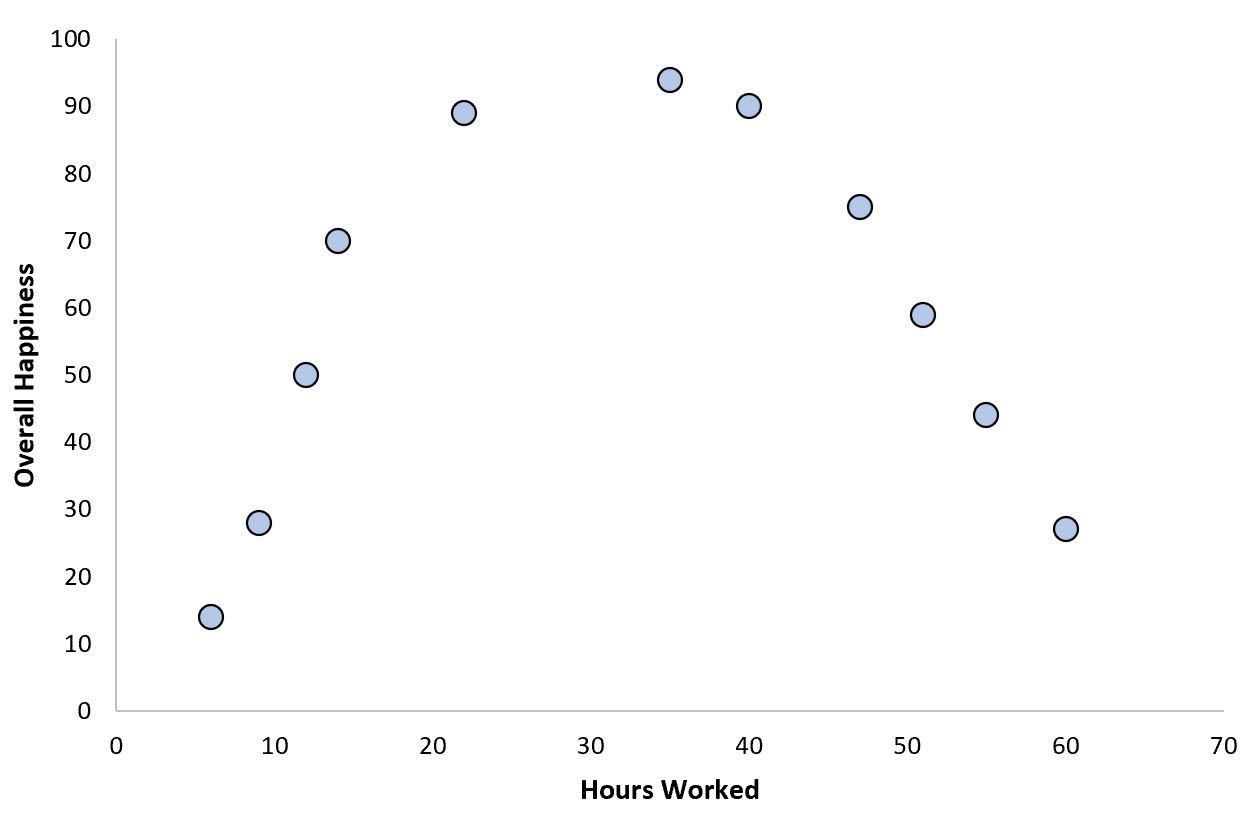
As working hours increase from zero, overall happiness tends to increase, but beyond a certain threshold more working hours actually leads to decreased happiness.
This upside down “U” shape is the signature shape of a quadratic relationship between two variables.
Example 2: Cubic Relationships
Another common nonlinear relationship in the real world is a cubic relationship between variables.
When plotted on a scatterplot, this relationship typically has two distinct curves.
This type of relationship exists often between variables in the field of thermodynamics:

Notice that there are two distinct curves on the plot and the relationship between variable X and variable Y is clearly not linear.
Example 3: Exponential Relationships
Another common nonlinear relationship in the real world is an exponential relationship between variables.
When plotted on a scatterplot, this relationship exhibits a single curve that becomes more pronounced as the variable on the x-axis increases.
One well-known example of an exponential relationship is the lifespan of bamboo plants and their yearly growth:

During the first few years of growth, a bamboo plant grows very slowly but once it reaches a certain age it explodes in height and grows at a rapid pace.
Example 4: Logarithmic Relationships
Another common nonlinear relationship in the real world is a logarithmic relationship between variables.
When plotted on a scatterplot, this relationship exhibits a single curve that becomes less pronounced as the variable on the x-axis increases.
One example of a logarithmic relationship is between the efficiency of smart-home technologies and time:
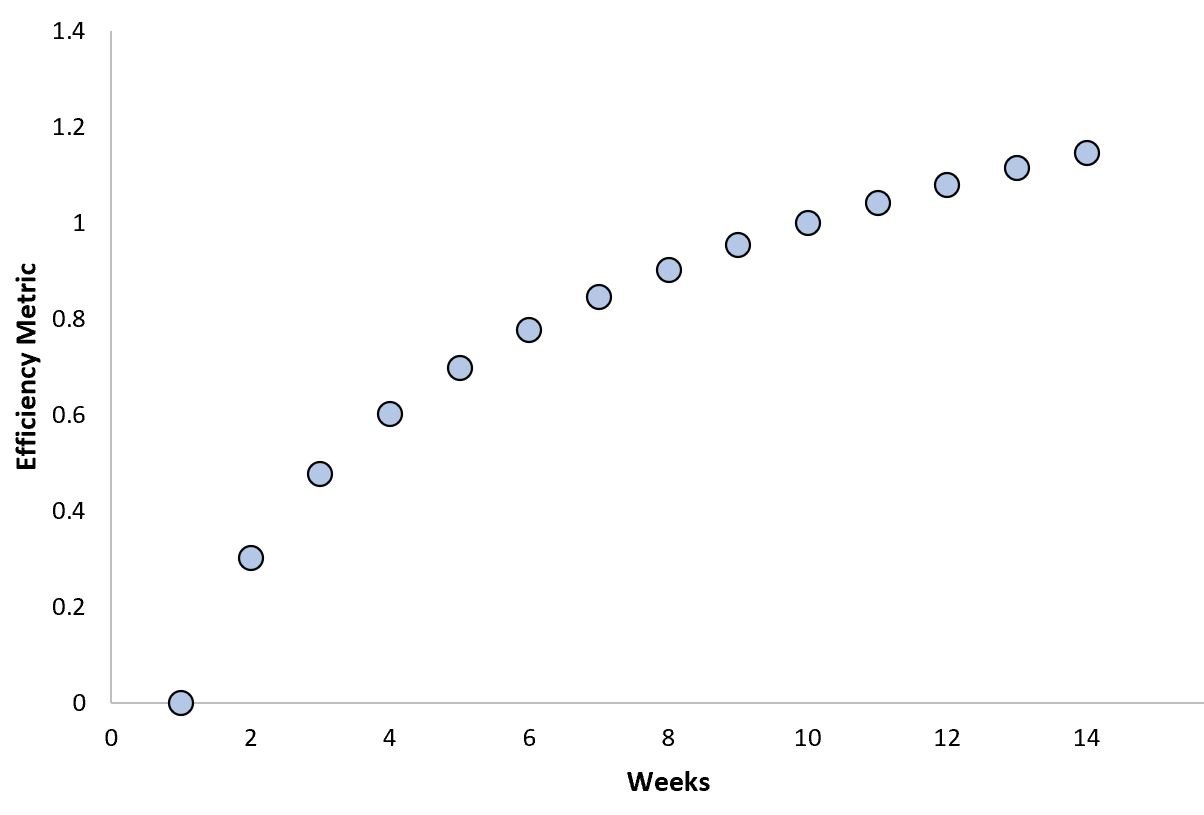
When a new smart-home technology (like a self-operating vacuum or self-operating AC unit) is installed in a home, it learns rapidly how to become more efficient, but then once it reaches a certain point it hits a maximum threshold in efficiency.
Example 5: Cosine Relationships
Another common nonlinear relationship in the real world is a cosine relationship between variables.
When plotted on a scatterplot, this relationship exhibits a “wave” shape.
One example of a cosine relationship is between the frequency of sound waves and time:
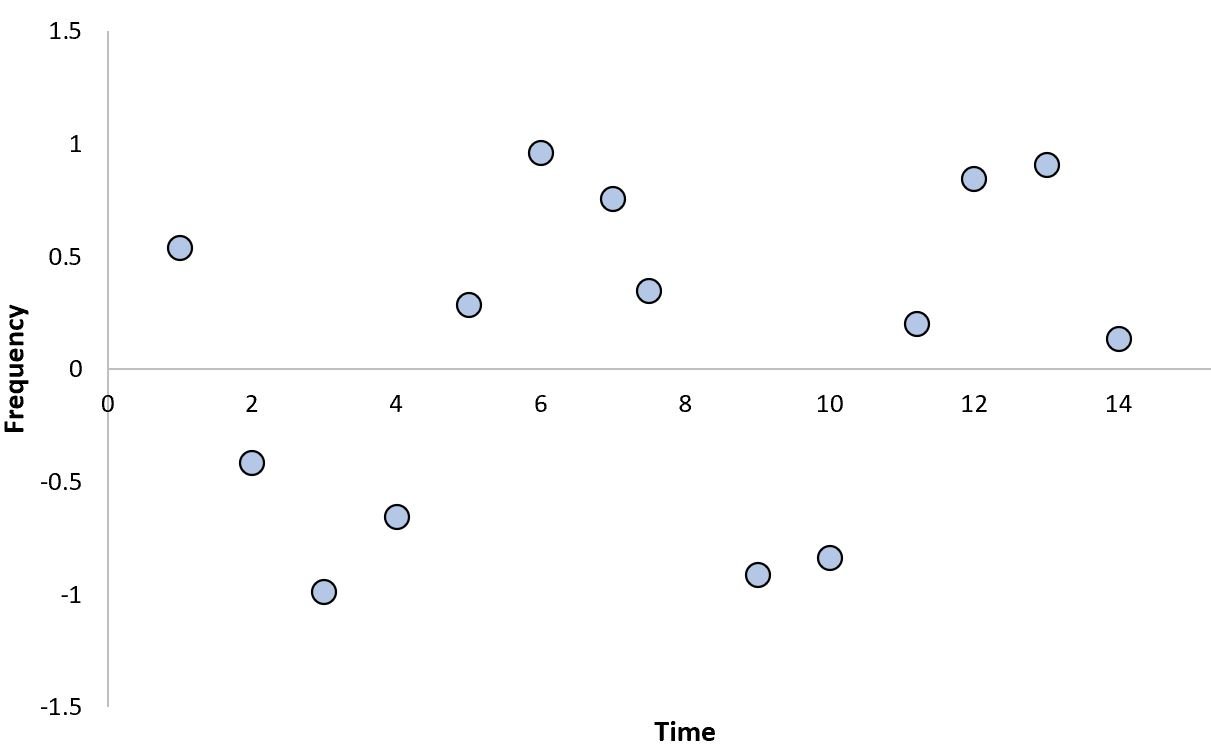
Notice how the relationship exhibits a “wave” shape, which is highly nonlinear.
Additional Resources
The following tutorials explain how to perform different types of nonlinear regression in Excel:
How to Perform Quadratic Regression in Excel
How to Perform Cubic Regression in Excel
How to Perform Exponential Regression in Excel
How to Perform Logarithmic Regression in Excel