A Chow test is used to test whether the coefficients in two different regression models on different datasets are equal.
This test is typically used in the field of econometrics with time series data to determine if there is a structural break in the data at some point.
The following a step-by-step example shows how to perform a Chow test in Python.
Step 1: Create the Data
First, we’ll create some fake data:
import pandas as pd

#create DataFrame
df = pd.DataFrame({'x': [1, 1, 2, 3, 4, 4, 5, 5, 6, 7, 7, 8, 8, 9, 10, 10,
                         11, 12, 12, 13, 14, 15, 15, 16, 17, 18, 18, 19, 20, 20],
                   'y': [3, 5, 6, 10, 13, 15, 17, 14, 20, 23, 25, 27, 30, 30, 31,
                         33, 32, 32, 30, 32, 34, 34, 37, 35, 34, 36, 34, 37, 38, 36]})

#view first five rows of DataFrame
df.head()

        x	y
0	1	3
1	1	5
2	2	6
3	3	10
4	4	13
Step 2: Visualize the Data
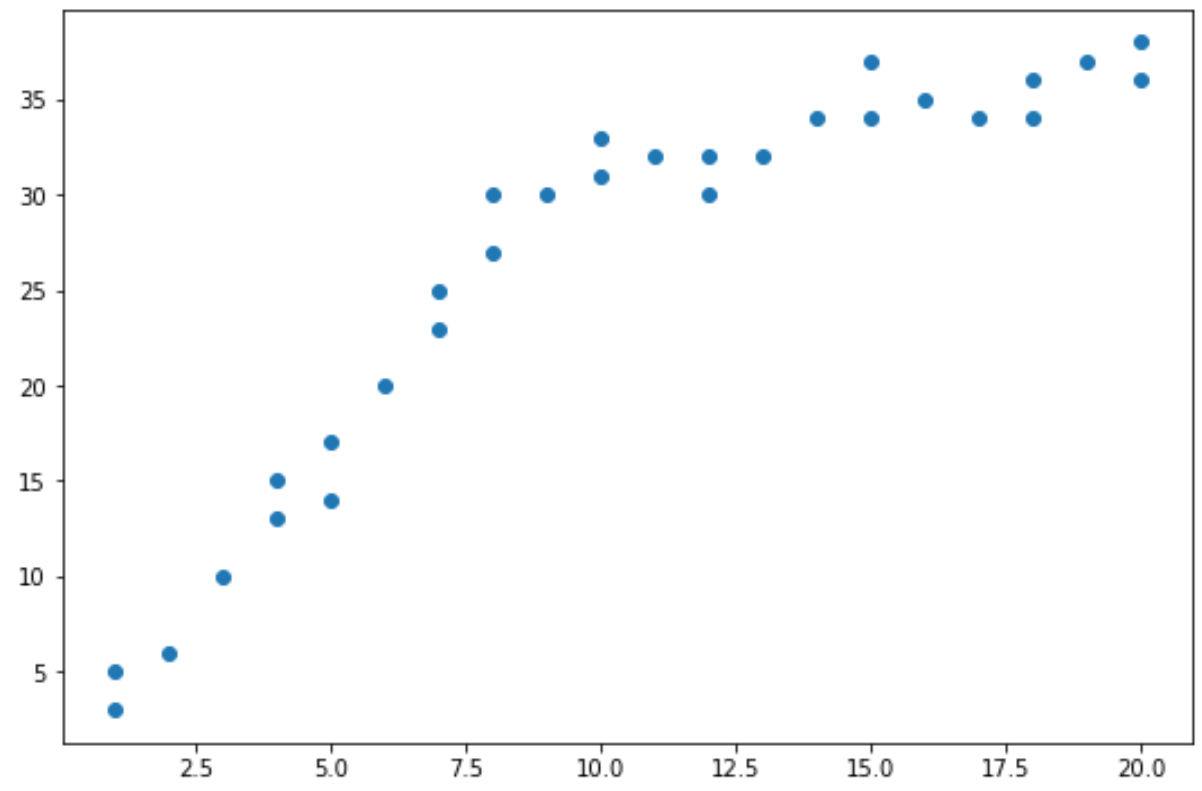
Next, we’ll create a simple scatterplot to visualize the data:
import matplotlib.pyplot as plt

#create scatterplot
plt.plot(df.x, df.y, 'o')
From the scatterplot we can see that the pattern in the data appears to change at x = 10.
Thus, we can perform the Chow test to determine if there is a structural break point in the data at x = 10.
Step 3: Perform the Chow Test
We can use the chowtest function from the chowtest package in Python to perform a Chow test.
First, we need to install this package using pip:
pip install chowtest
Next, we can use the following syntax to perform the Chow test:
from chow_test import chowtest

chowtest(y=df[['y']], X=df[['x']],
         last_index_in_model_1=15,
         first_index_in_model_2=16,
         significance_level=.05)

***********************************************************************************
Reject the null hypothesis of equality of regression coefficients in the 2 periods.
***********************************************************************************
Chow Statistic: 118.14097335479373 p value: 0.0
***********************************************************************************
(118.14097335479373, 1.1102230246251565e-16)
Here’s what the individual arguments mean in the chowtest() function:
- y: The response variable in the DataFrame
- x: The predictor variable in the DataFrame
- last_index_in_model_1: The index value for the last point before the structural break
- first_index_in_model_2: The index value for the first point after the structural break
- significance_level: The significance level to use for the hypothesis test
From the output of the test we can see:
- F test statistic: 118.14
- p-value: <.0000>
Since the p-value is less than .05, we can reject the null hypothesis of the test. This means we have sufficient evidence to say that a structural break point is present in the data.
In other words, two regression lines can fit the pattern in the data more effectively than a single regression line.
Additional Resources
The following tutorials explain how to perform other common tests in Python:
How to Perform a Granger-Causality Test in Python
How to Perform a Breusch-Pagan Test in Python
How to Perform White’s Test in Python


