A cumulative average tells us the average of a series of values up to a certain point.
The following step-by-step example shows how to calculate a cumulative average for a dataset in Excel.
Step 1: Enter the Data
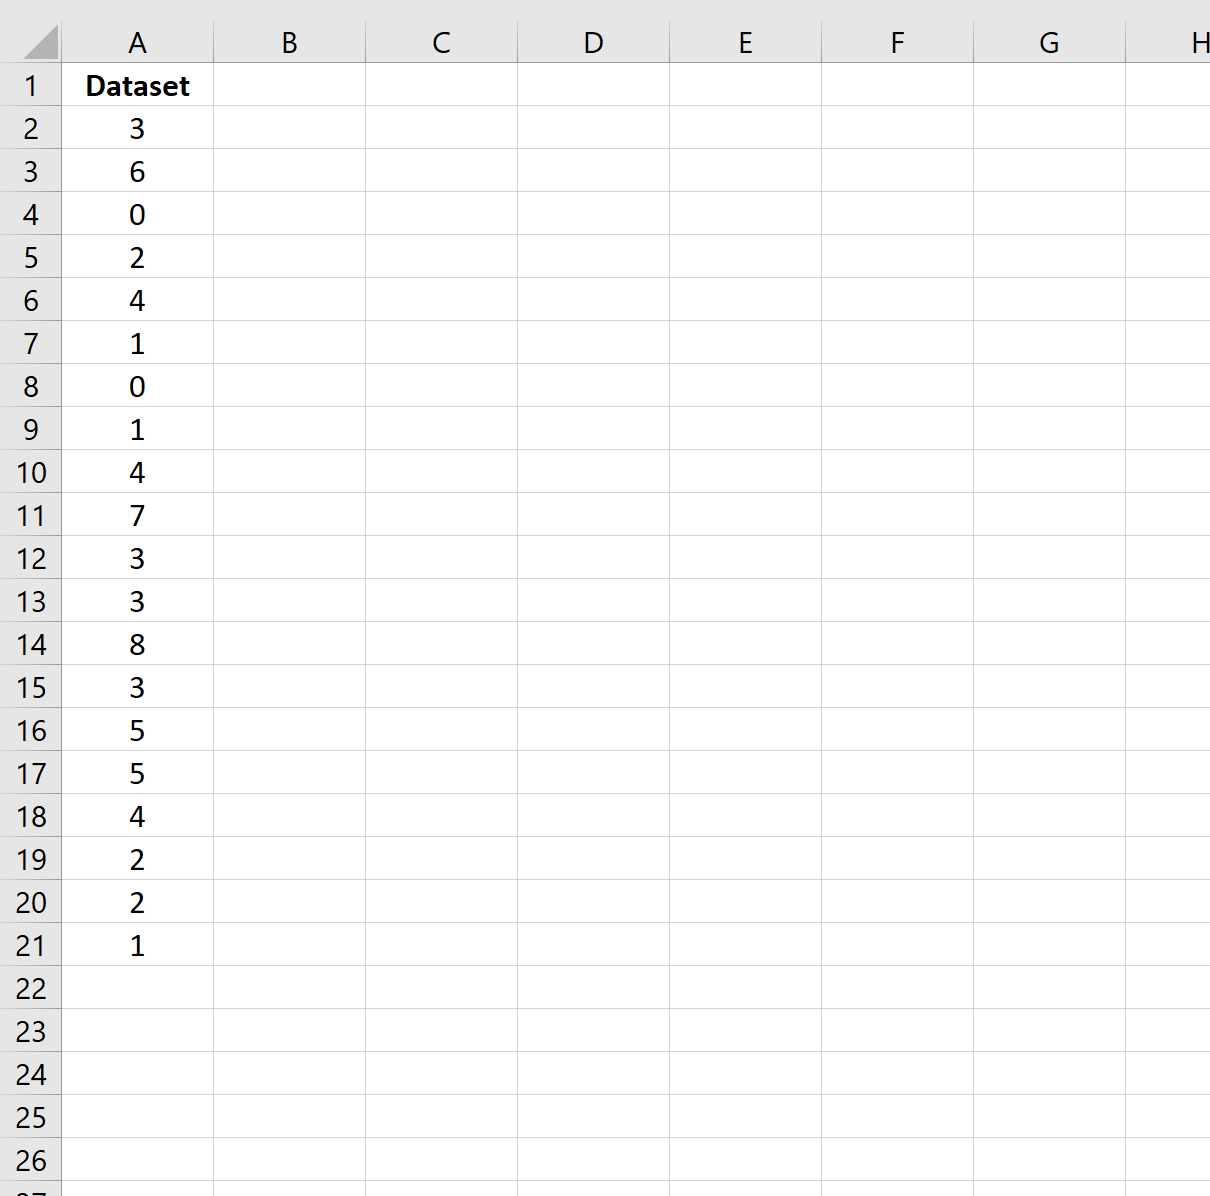
First, let’s enter the values for a given dataset:
Step 2: Calculate the First Cumulative Average Value
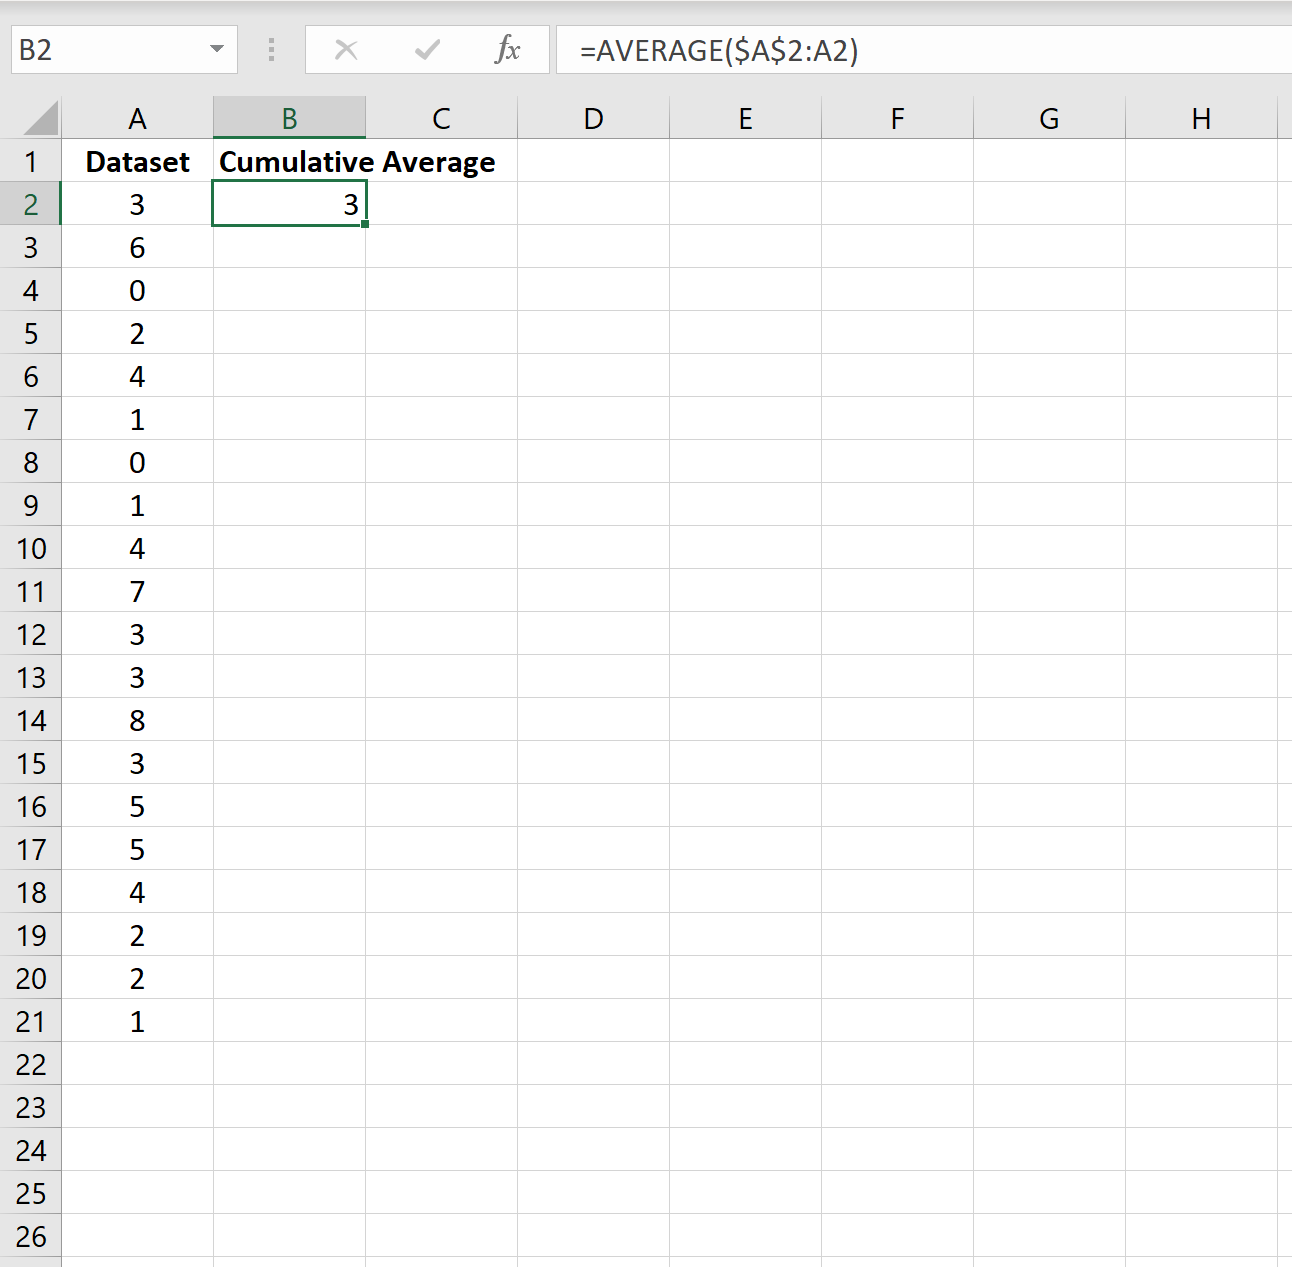
Next, we can use the following formula to calculate the first cumulative average value:
=AVERAGE($A$2:A2)
Step 3: Calculate the Remaining Cumulative Average Values
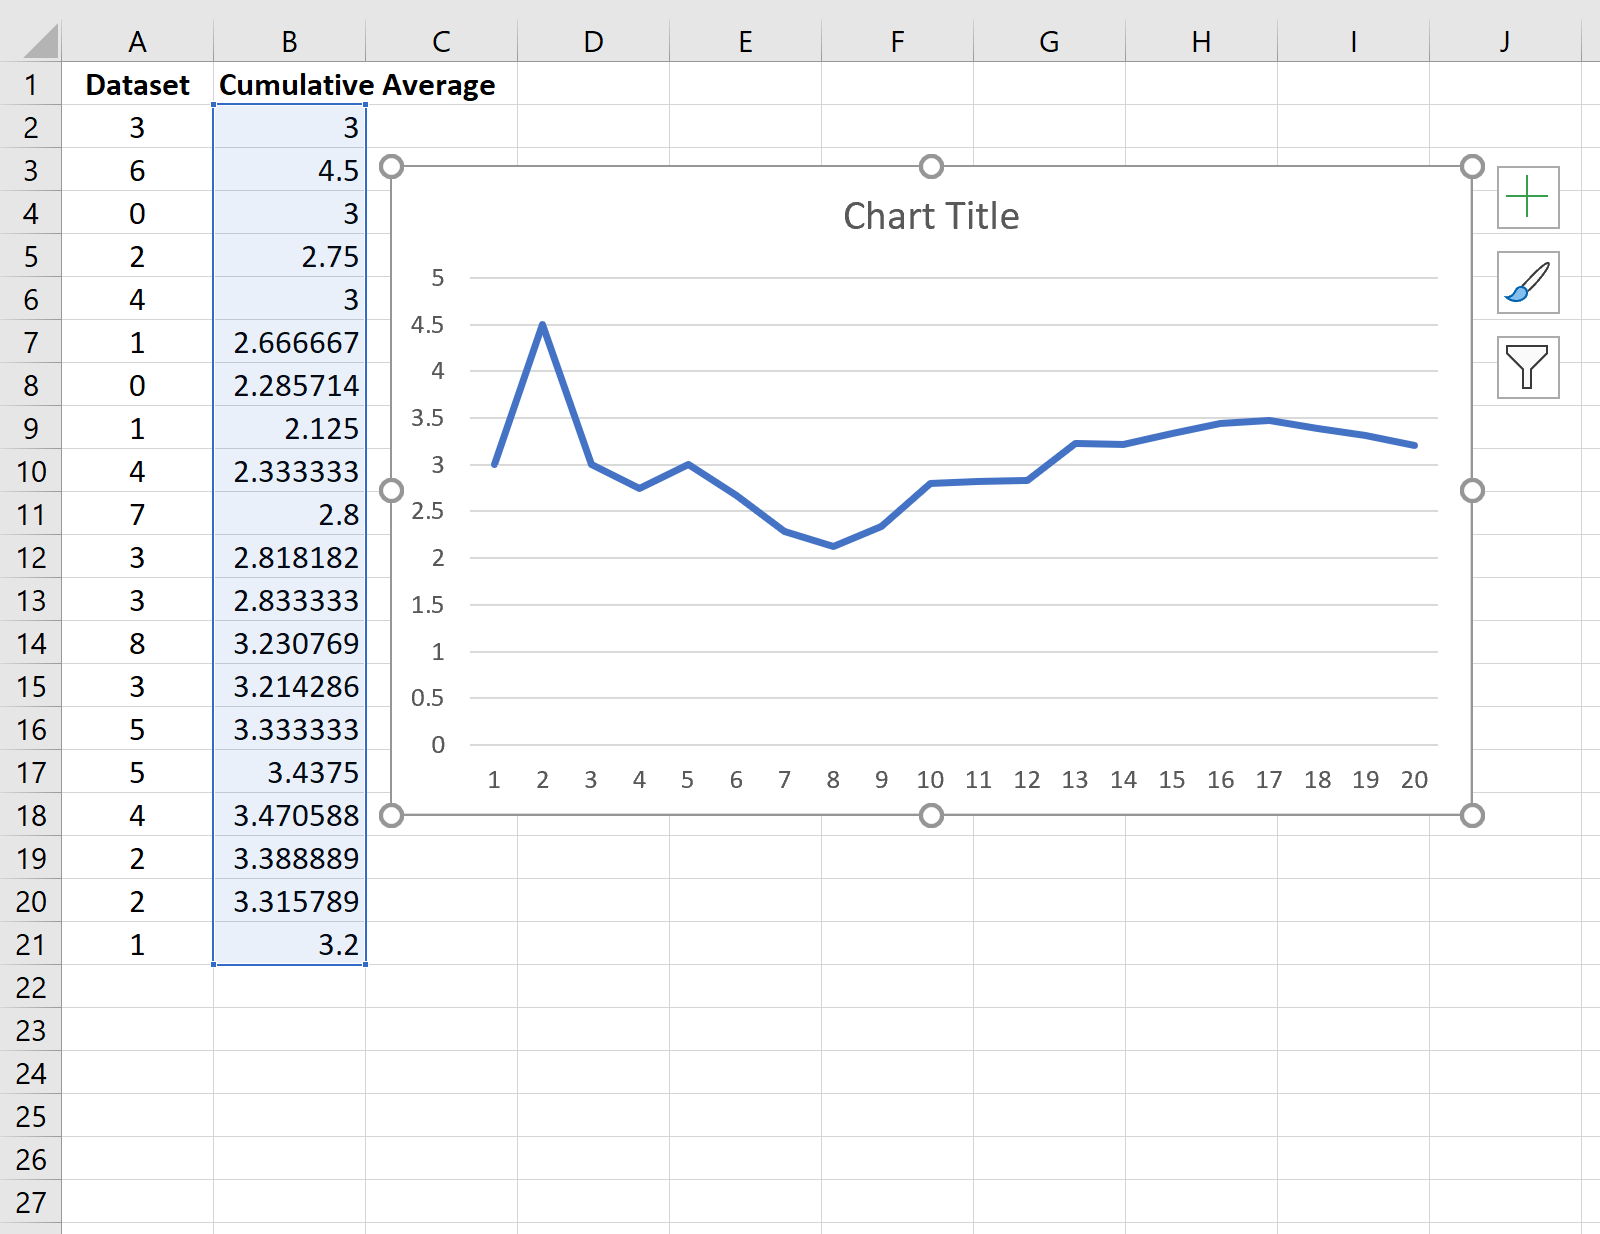
Next, we can simply copy and paste this formula down to the remaining cells in column B:
We would interpret the cumulative average values as:
- The cumulative average of the first value is 3.
- The cumulative average of the first two values is 4.5.
- The cumulative average of the first three values is 3.
And so on.
Step 4: Plot the Cumulative Average Values
We can plot the cumulative average values by highlighting every value in column B, then clicking the Insert tab along the top ribbon, then clicking Insert Line Chart:
Additional Resources
The following tutorials explain how to calculate other common metrics in Excel:
How to Find Moving Averages in Excel
How to Find Weighted Moving Averages in Excel
How to Calculate an Exponential Moving Average in Excel


