The Poisson distribution describes the probability of obtaining k successes during a given time interval.
If a random variable X follows a Poisson distribution, then the probability that X = k successes can be found by the following formula:
P(X=k) = λk * e– λ / k!
where:
- λ: mean number of successes that occur during a specific interval
- k: number of successes
- e: a constant equal to approximately 2.71828
The following example explains how to create a Poisson distribution graph in Excel.
Example: Poisson Distribution Graph in Excel
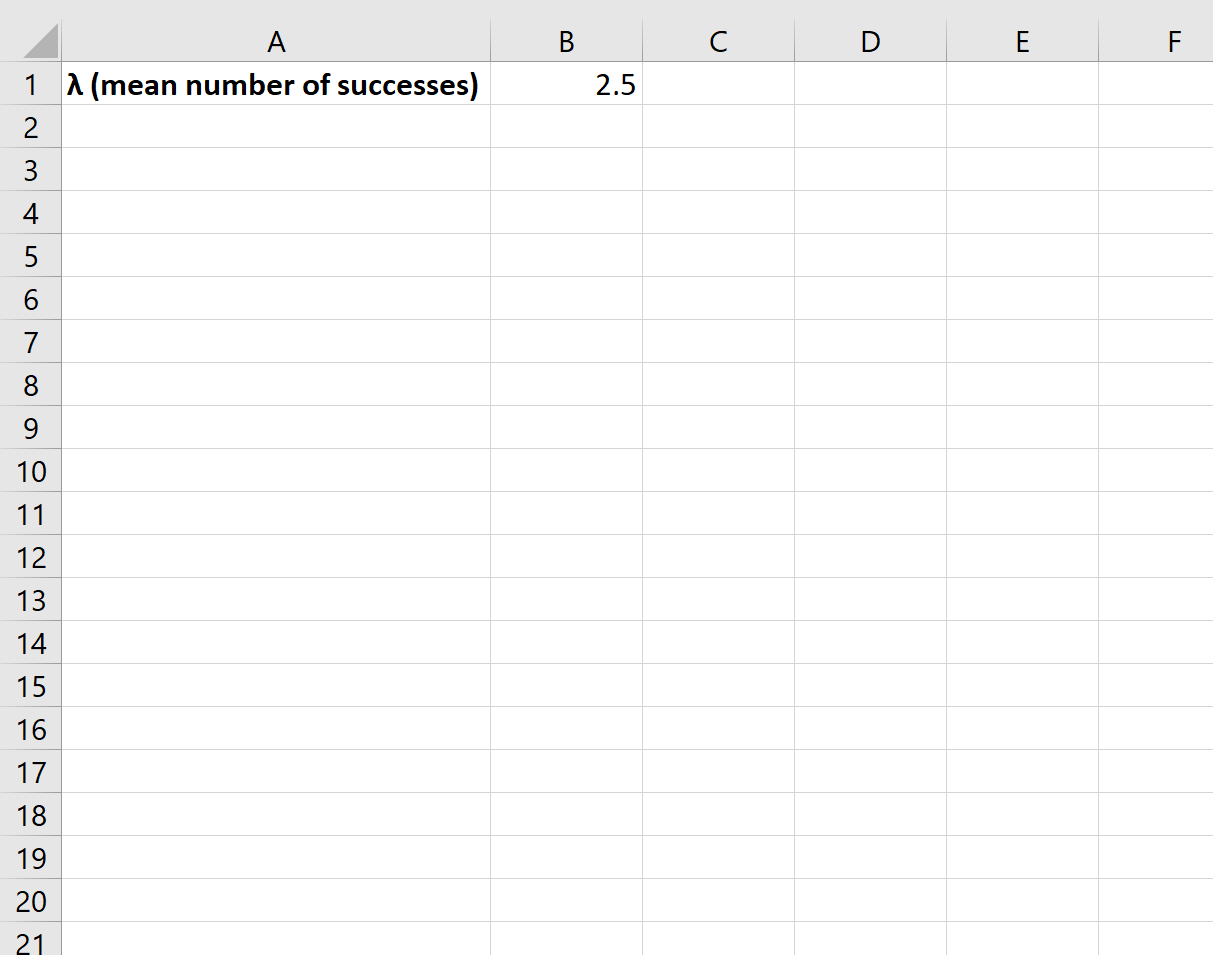
To create a Poisson distribution graph, we need to first decide on a value for λ (mean number of successes):
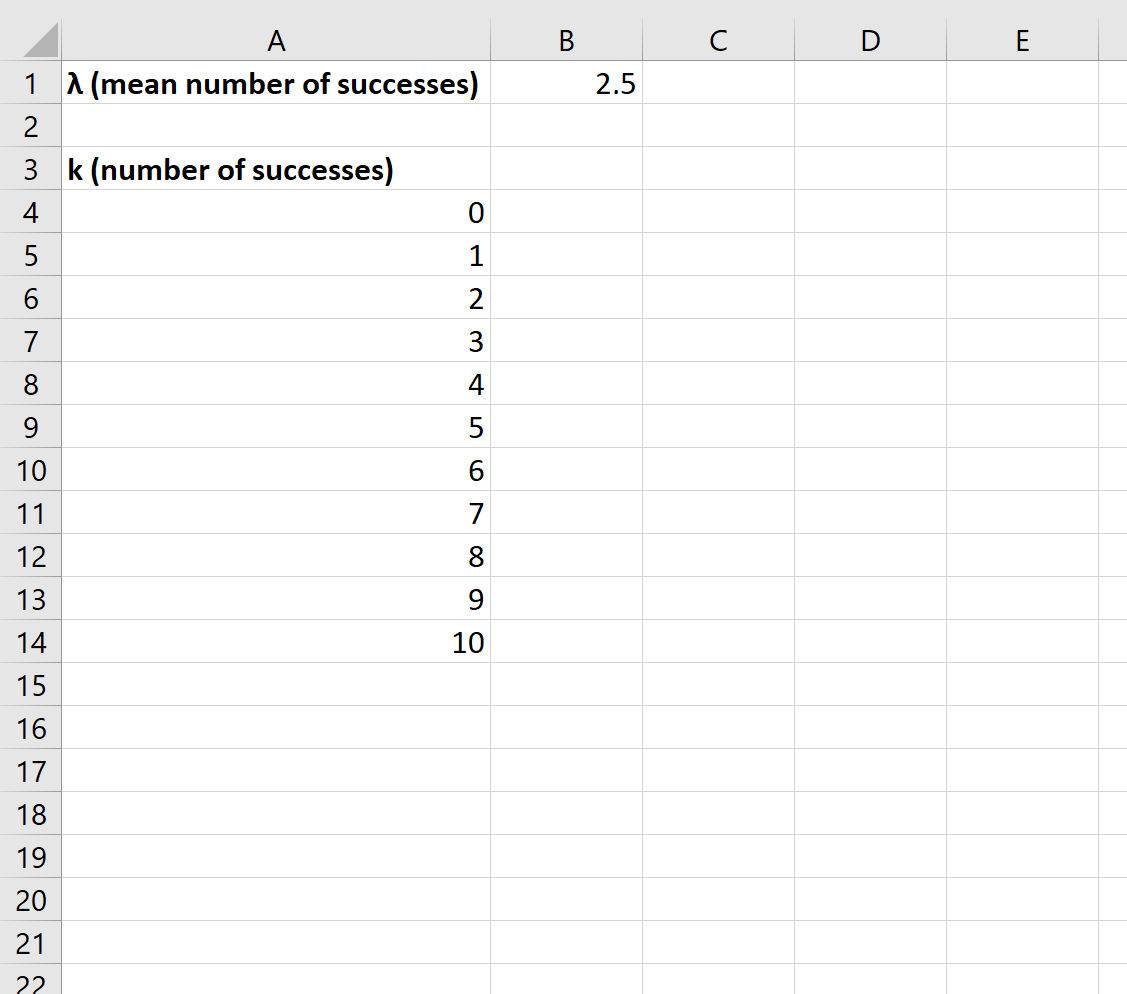
Next, we need to create a column for each possible number of successes:
Note that we chose k = 10 possible successes. We could have chosen more, but the probabilities become very small for values greater than 10, as we’ll see later in this post.
Next, we can use the POISSON.DIST() function to calculate the Poisson probability for the first number of successes:
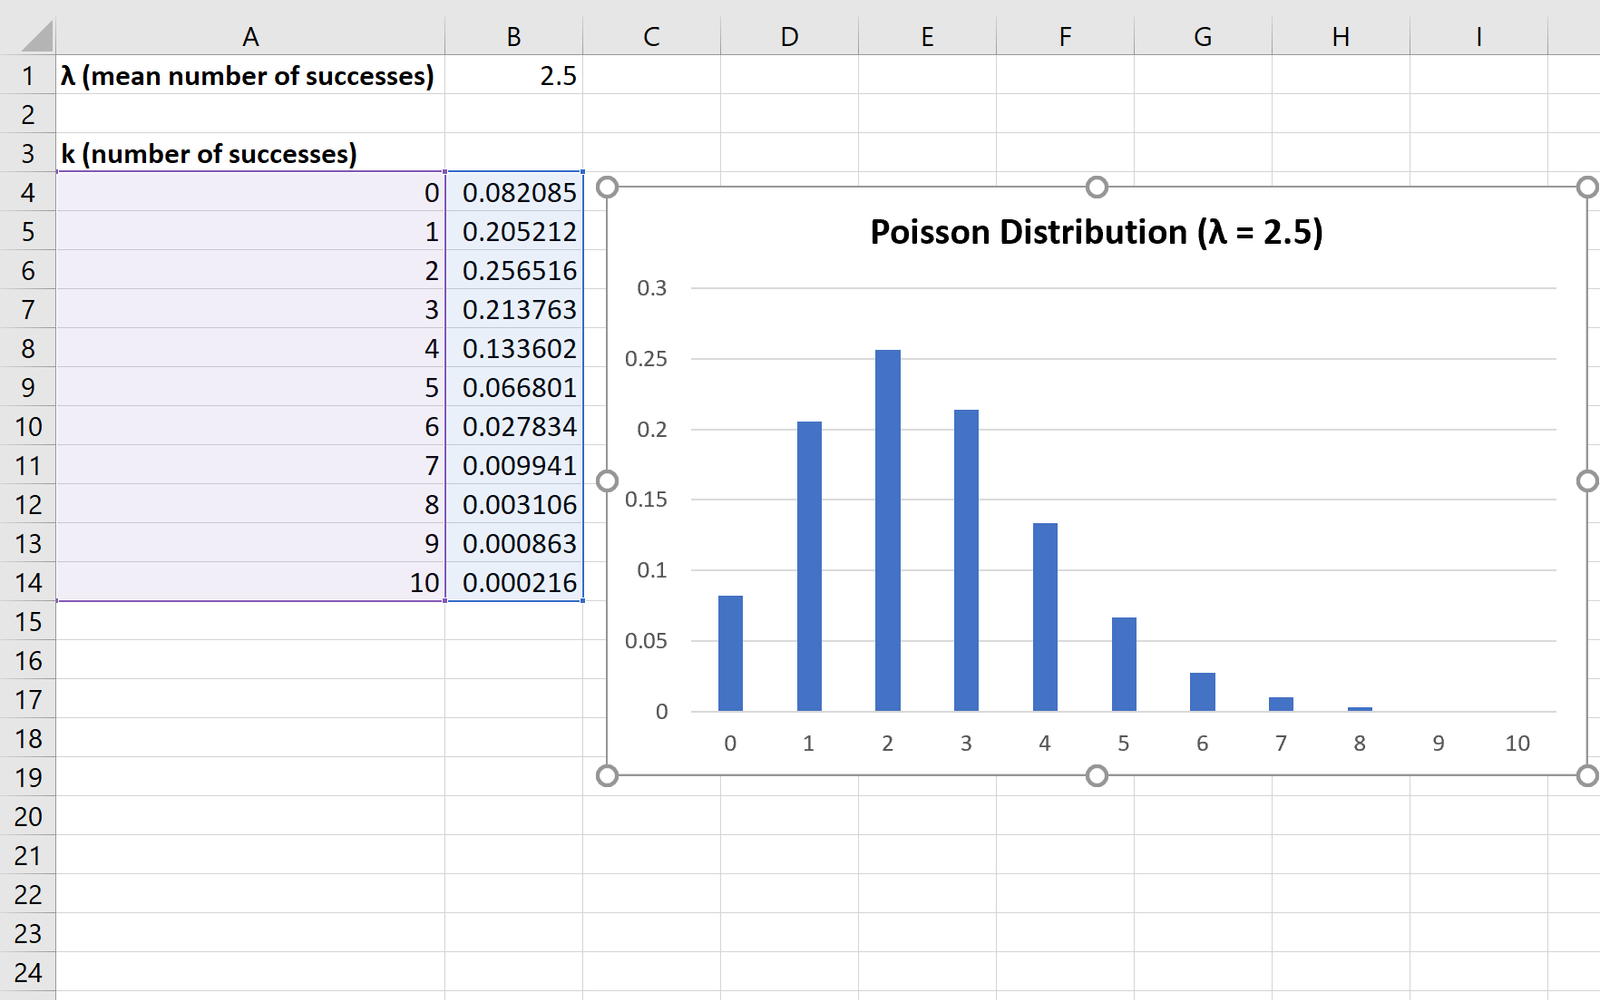
We can then copy and paste this formula to the remaining cells in column B:
Lastly, we can highlight each of the Poisson probabilities, then click the Insert tab along the top ribbon, then click the Insert Column or Bar Chart icon in the Charts group:
The x-axis of the graph shows the number of successes and the y-axis shows the corresponding probability of that many successes.
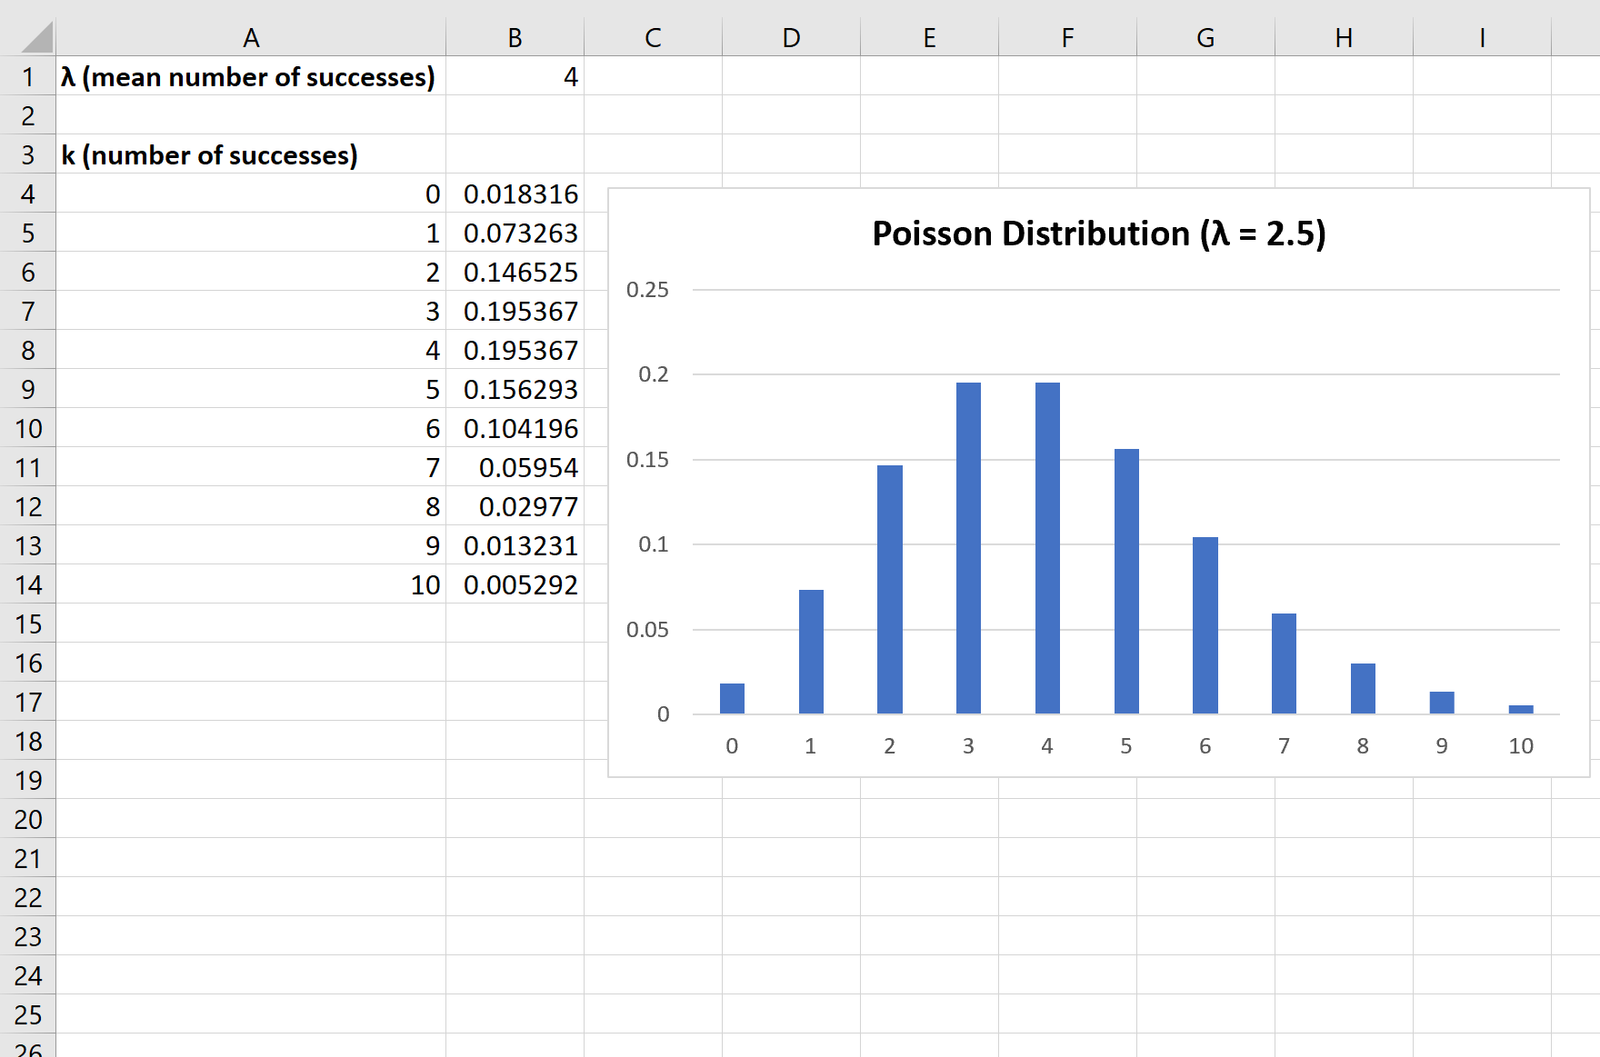
Note that if you change the value for λ (mean number of successes), the graph will automatically change to reflect the new probabilities.
For example, if we change the λ value to 4, the Poisson probabilities and the graph will automatically update:
Additional Resources
Poisson Distribution Calculator
How to Use the Poisson Distribution in Excel
How to Calculate Poisson Probabilities on a TI-84 Calculator


