The normal distribution is the most commonly used probability distribution in statistics.
It has the following properties:
- Symmetrical
- Bell-shaped
If we create a plot of the normal distribution, it will look something like this:
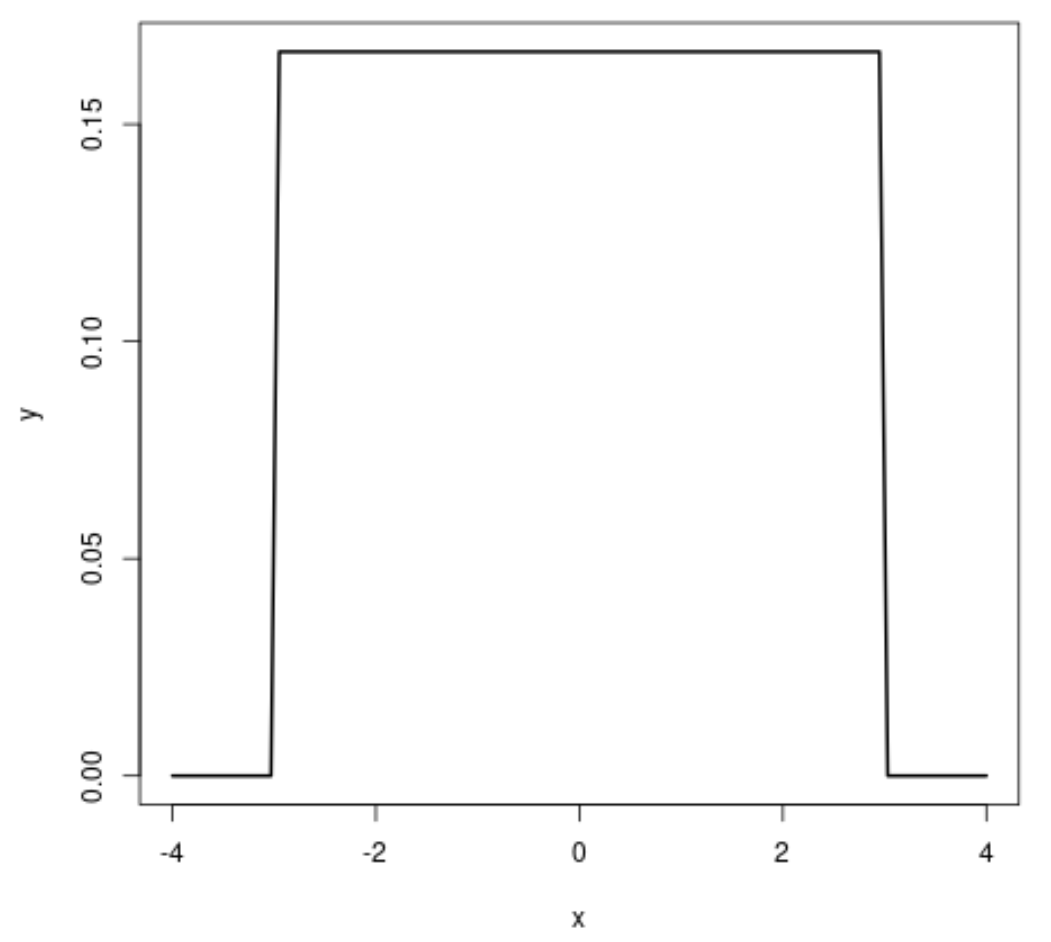
The uniform distribution is a probability distribution in which every value between an interval from a to b is equally likely to occur.
It has the following properties:
- Symmetrical
- Rectangular-shaped
If we create a plot of the uniform distribution, it will look something like this:
The normal distribution and uniform distribution share the following similarity:
- Both distributions are symmetrical. That is, if we were to draw a line down the center of the distribution, the left and right sides of the distribution would perfectly mirror each other:
However, the two distributions have the following difference:
- The distributions have different shapes.
- The normal distribution is bell-shaped, which means value near the center of the distribution are more likely to occur as opposed to values on the tails of the distribution.
- The uniform distribution is rectangular-shaped, which means every value in the distribution is equally likely to occur.
Normal Distribution vs. Uniform Distribution: When to Use Each
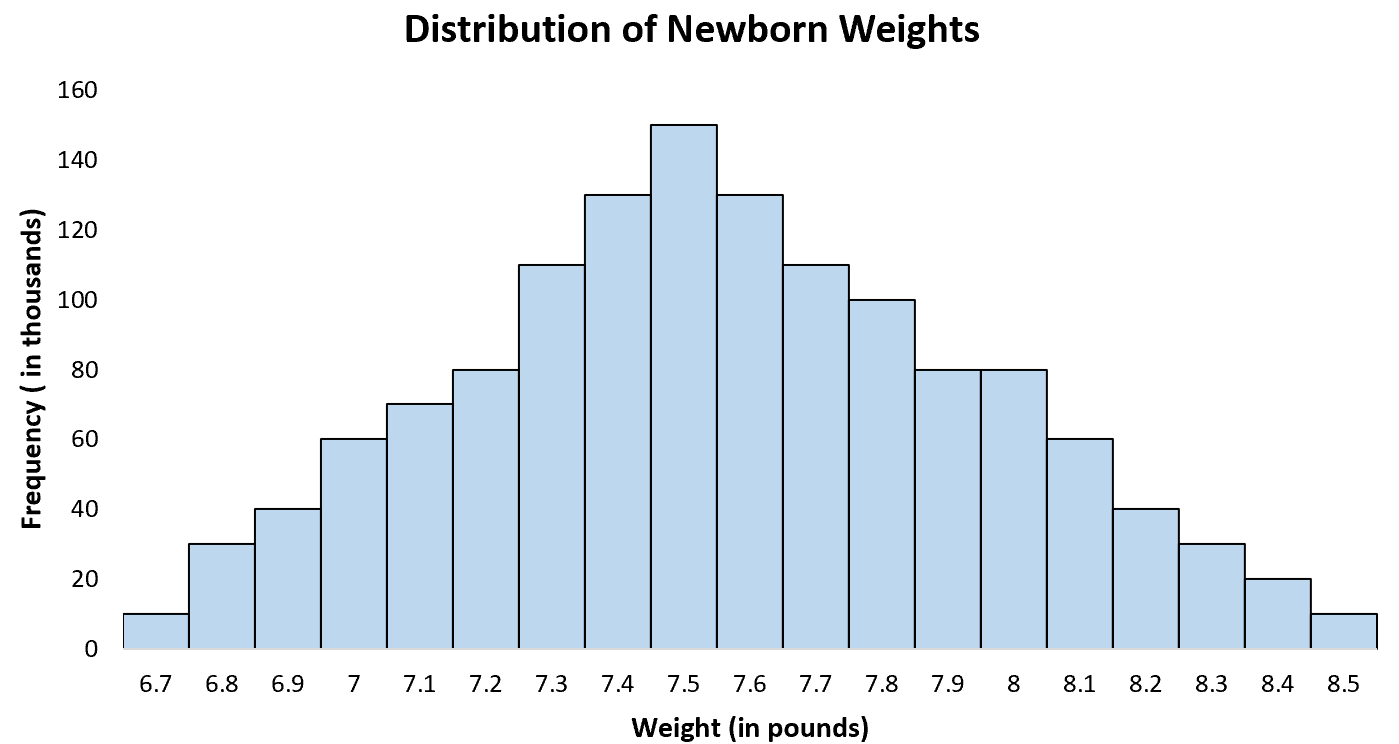
The normal distribution is used to model phenomenon that tend to follow a “bell-curve” shape. For example, it’s well-documented that the birthweight of newborn babies is normally distributed with a mean of about 7.5 pounds.
The histogram of the birthweight of newborn babies in the U.S. displays a bell-shape that is typically of the normal distribution:
Most babies are likely to weight around 7.5 pounds, with few weighing less than 7 pounds and few weighing more than 8 pounds.
Conversely, the uniform distribution is used to model scenarios where each potential outcome is equally likely.
A classic example is rolling a die. If you roll a die one time, the probability that it falls on a number between 1 and 6 follows a uniform distribution because each number is equally likely to occur.
For example, there are 6 possible numbers the die can land on so the probability that you roll a 1 is 1/6.
Similarly, the probability that you roll a 2 is 1/6.
Similarly, the probability that you roll a 3 is 1/6.
And so on.
Bonus: How to Plot the Normal & Uniform Distribution
We used the following code in R to create plots of the normal and uniform distributions:
#define x-axis
x #calculate normal distribution probabilities
y #plot normal distribution
plot(x, y, type = "l", lwd = 2)

#define x-axis
x #calculate uniform distribution probabilities
y #plot uniform distribution
plot(x, y, type = "l", lwd = 2, xlim = c(-4, 4))
Additional Resources
6 Real-Life Examples of the Normal Distribution
5 Real-Life Examples of the Uniform Distribution
Symmetric Distribution: Definition + Examples


