A probability distribution tells us the probability that a random variable takes on certain values.
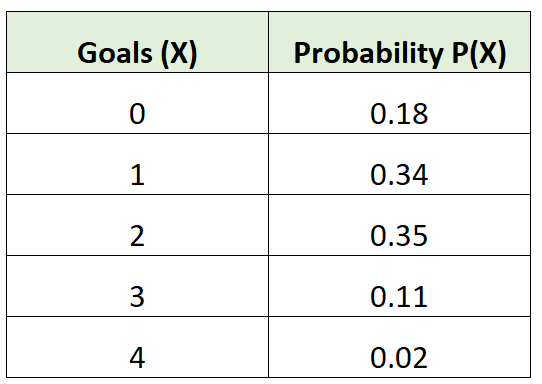
For example, the following probability distribution tells us the probability that a certain soccer team scores a certain number of goals in a given game:
To find the expected value of a probability distribution, we can use the following formula:
μ = Σx * P(x)
where:
- x: Data value
- P(x): Probability of value
For example, the expected number of goals for the soccer team would be calculated as:
μ = 0*0.18 + 1*0.34 + 2*0.35 + 3*0.11 + 4*0.02 = 1.45 goals.
The following example provides a step-by-step example of how to calculate the expected value of a probability distribution in Excel.
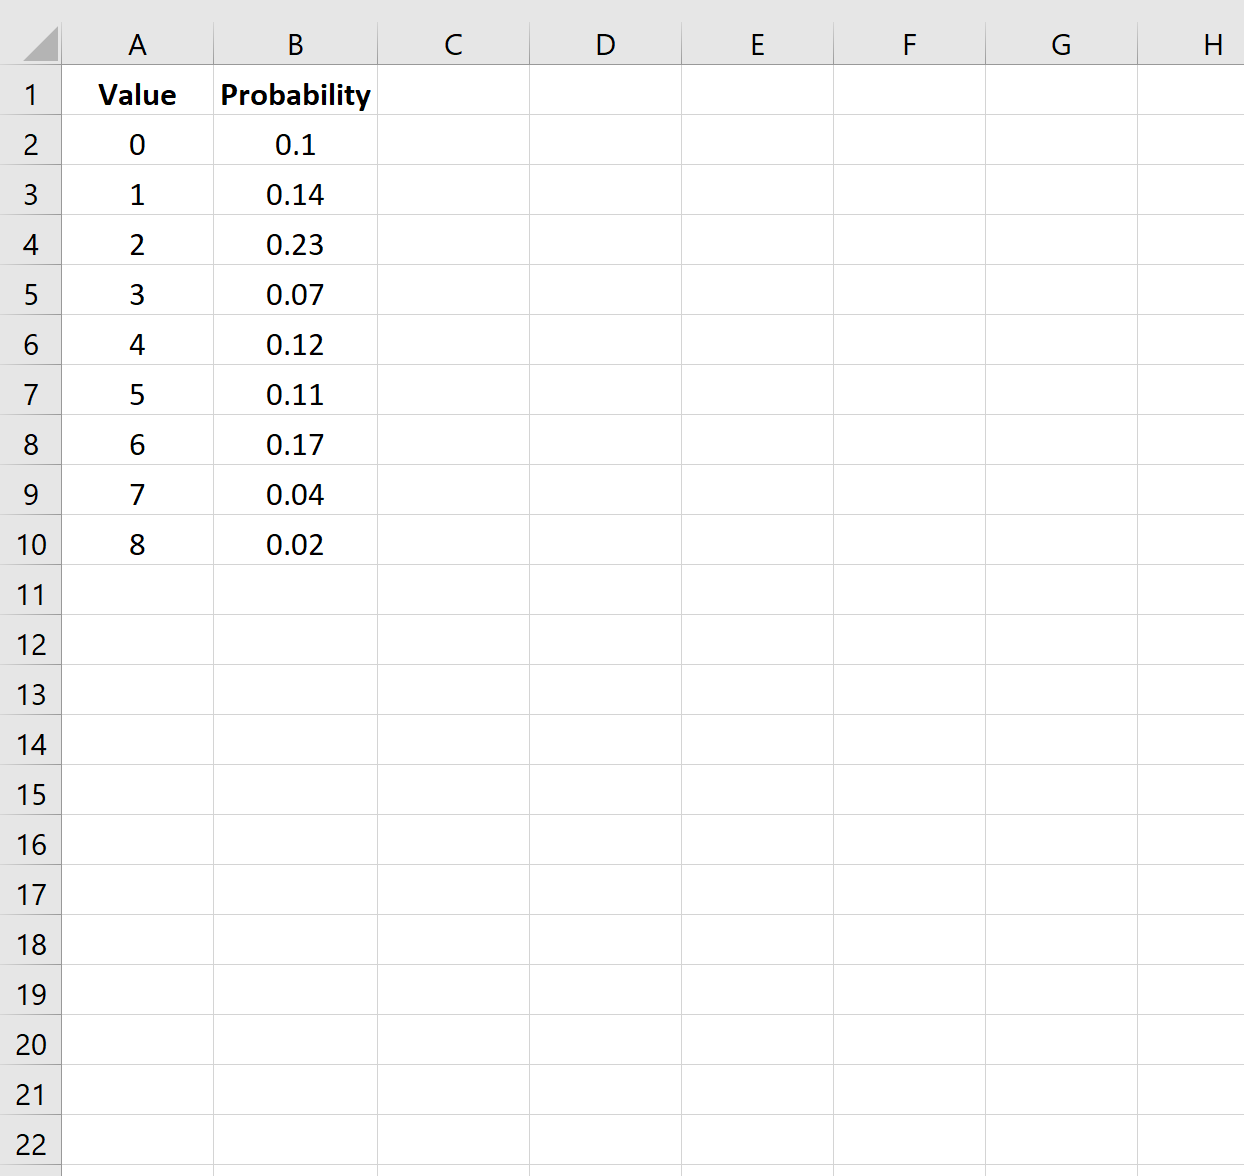
Step 1: Enter the Data
First, let’s enter the data values and corresponding probabilities for a given probability distribution:
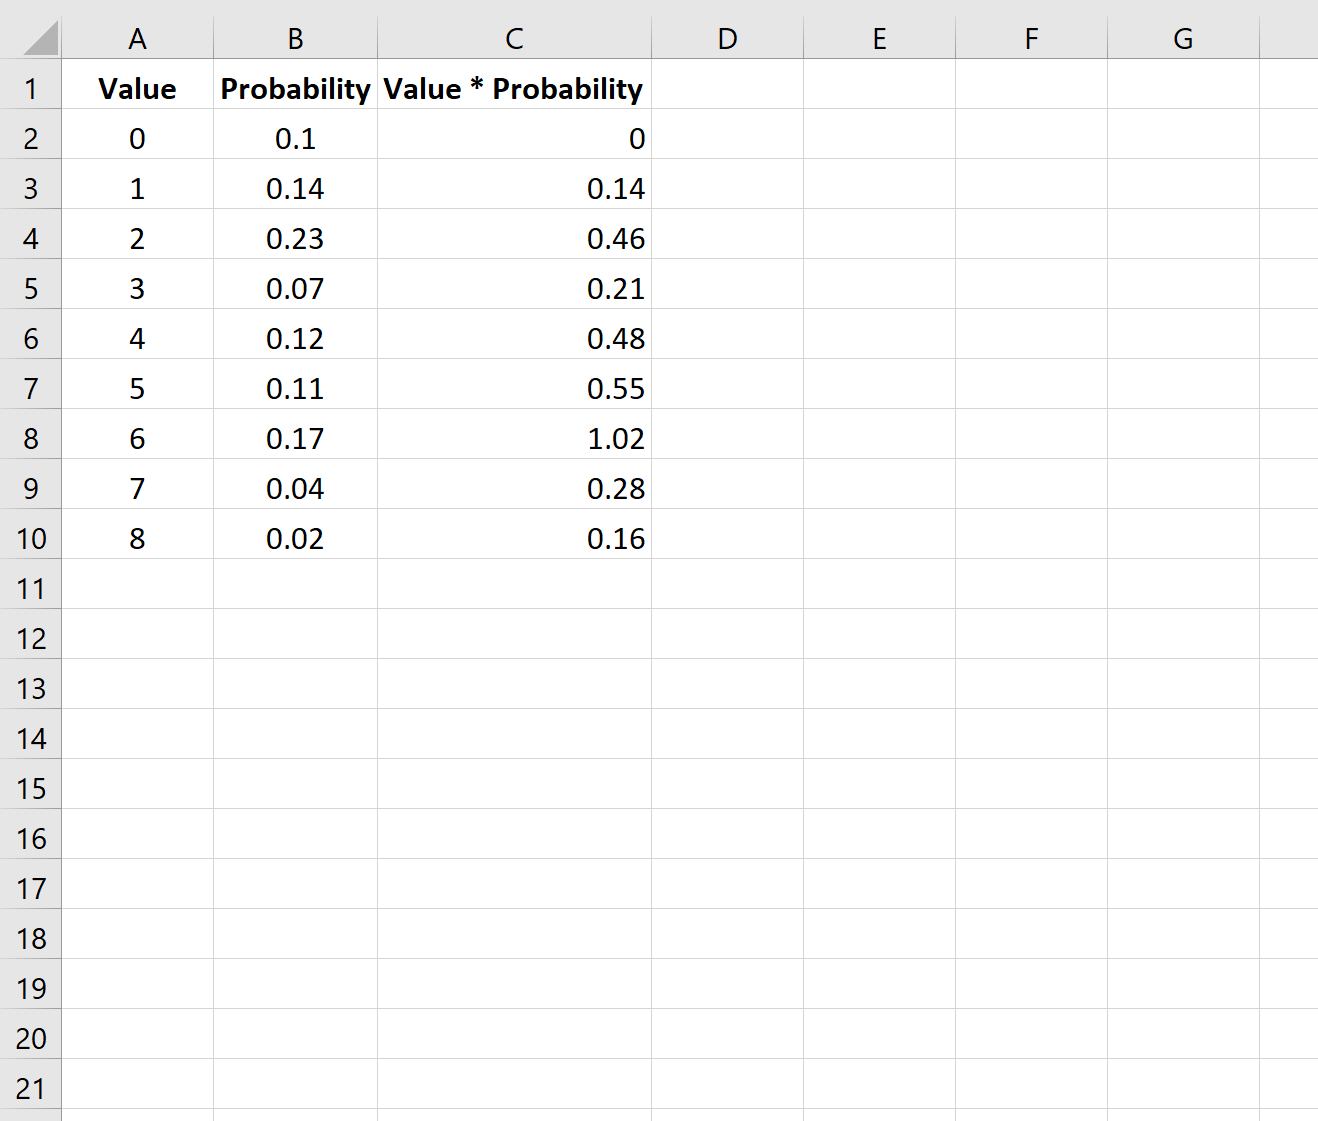
Step 2: Multiply Values and Probabilities
Next, we’ll multiply the first number in the ‘Values’ column with the first number in the ‘Probability’ column:
We’ll then copy and paste this formula down to every cell in column C:
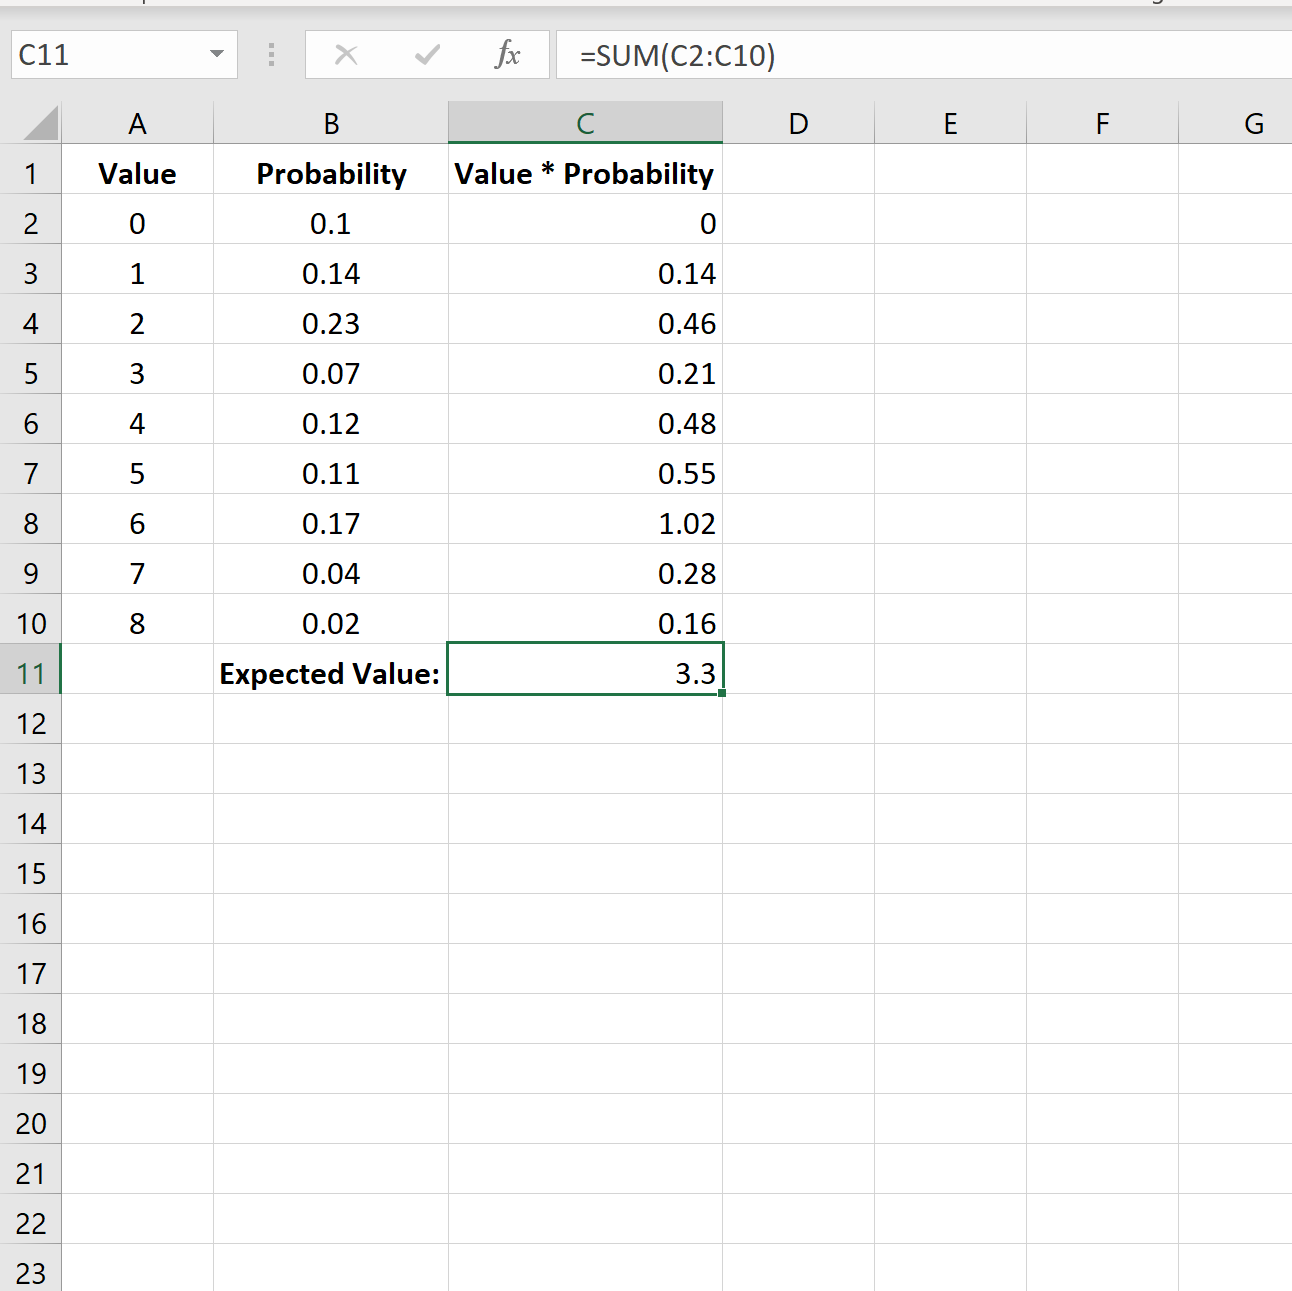
Step 3: Calculate Expected Value
Lastly, we can calculate the expected value of the probability distribution by using SUM(C2:C10) to sum all of the values in column C:
The expected value for this probability distribution is 3.3.
Additional Resources
The following tutorials explain how to calculate other descriptive statistics in Excel:
How to Find Mean, Median & Mode in Excel
How to Calculate the Interquartile Range in Excel
How to Calculate the Coefficient of Variation in Excel


