A one-way ANOVA is used to determine whether or not there is a statistically significant difference between the means of three or more independent groups.
The hypotheses used in an ANOVA are as follows:
H0: The means are equal for each group.
HA: At least one of the means is different from the others.
If the p-value from the ANOVA is less than some significance level (like α = .05), we can reject the null hypothesis and conclude that at least one of the group means is different from the others.
But in order to find out exactly which groups are different from each other, we must conduct a post-hoc test.
One commonly used post-hoc test is Fisher’s least significant difference test.
To perform this test, we first calculate the following test statistic:
LSD = t.025, DFw * √MSW(1/n1 + 1/n1)
where:
- t.025, DFw: The t-critical value from the t-distribution table with α = .025 and DFw is the degrees of freedom within groups from the ANOVA table.
- MSW: The mean squares within groups from the ANOVA table.
- n1, n2: The sample sizes of each group
We can then compare the mean difference between each group to this test statistic. If the absolute value of the mean difference between two groups is greater than the test statistic, we can declare that there is a statistically significant difference between the group means.
The following example shows how to perform Fisher’s least significant difference test in practice.
Example: Fisher’s Least Significance Difference Test
Suppose a professor wants to know whether or not three different studying techniques lead to different exam scores among students. To test this, she randomly assigns 10 students to use each studying technique and records their exam scores.
The following table shows the exam scores for each student based on the studying technique they used:

The professor performs a one-way ANOVA and get the following results:
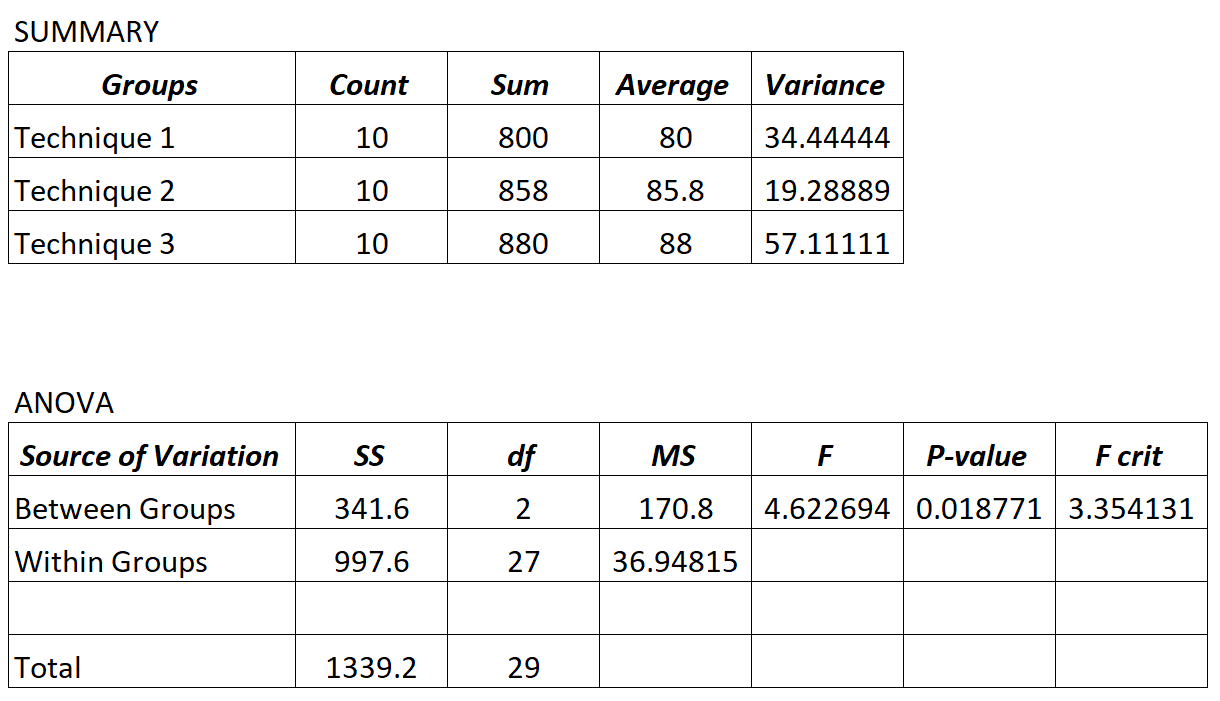
Since the p-value in the ANOVA table (.018771) is less than .05, we can conclude that not all of the mean exam scores between the three groups are equal.
Thus, we can proceed to perform Fisher’s least significant difference test to determine which group means are different.
Using values from the output of the ANOVA, we can calculate Fisher’s test statistic as:
- LSD = t.025, DFw * √MSW(1/n1 + 1/n1)
- LSD = t.025, 27 * √36.948*(1/10 + 1/10)
- LSD = 2.052 * √7.3896
- LSD = 5.578
We can then calculate the absolute mean difference between each group:
- Technique 1 vs. Technique 2: |80 – 85.8| = 5.8
- Technique 1 vs. Technique 3: |80 – 88| = 8
- Technique 2 vs. Technique 3: |85.8 – 88| = 2.2
The absolute mean differences between technique 1 vs. technique 2 and technique 1 vs. technique 3 are greater than Fisher’s test statistic, thus we can conclude that these techniques lead to statistically significantly different mean exam scores.
We can also conclude that there is no significant difference in mean exam scores between technique 2 and technique 3.