In time series analysis, a moving average is simply the average value of a certain number of previous periods.
An exponential moving average is a type of moving average that gives more weight to recent observations, which means it’s able to capture recent trends more quickly.
The following step-by-step example shows how to calculate an exponential moving average in Google Sheets.
Step 1: Enter the Data
First, let’s enter the following dataset that shows the total sales made by a company during 10 consecutive sales periods:
Step 2: Calculate the Exponential Moving Average
Next, we’ll calculate the exponential moving average (EMA) using the following formula:
EMV = [Latest Value - Previous EMA] * (2/n+1) + Previous EMA
In the formula, n represents the number of periods to use to calculate the exponential moving average. This is the one number that you must specify.
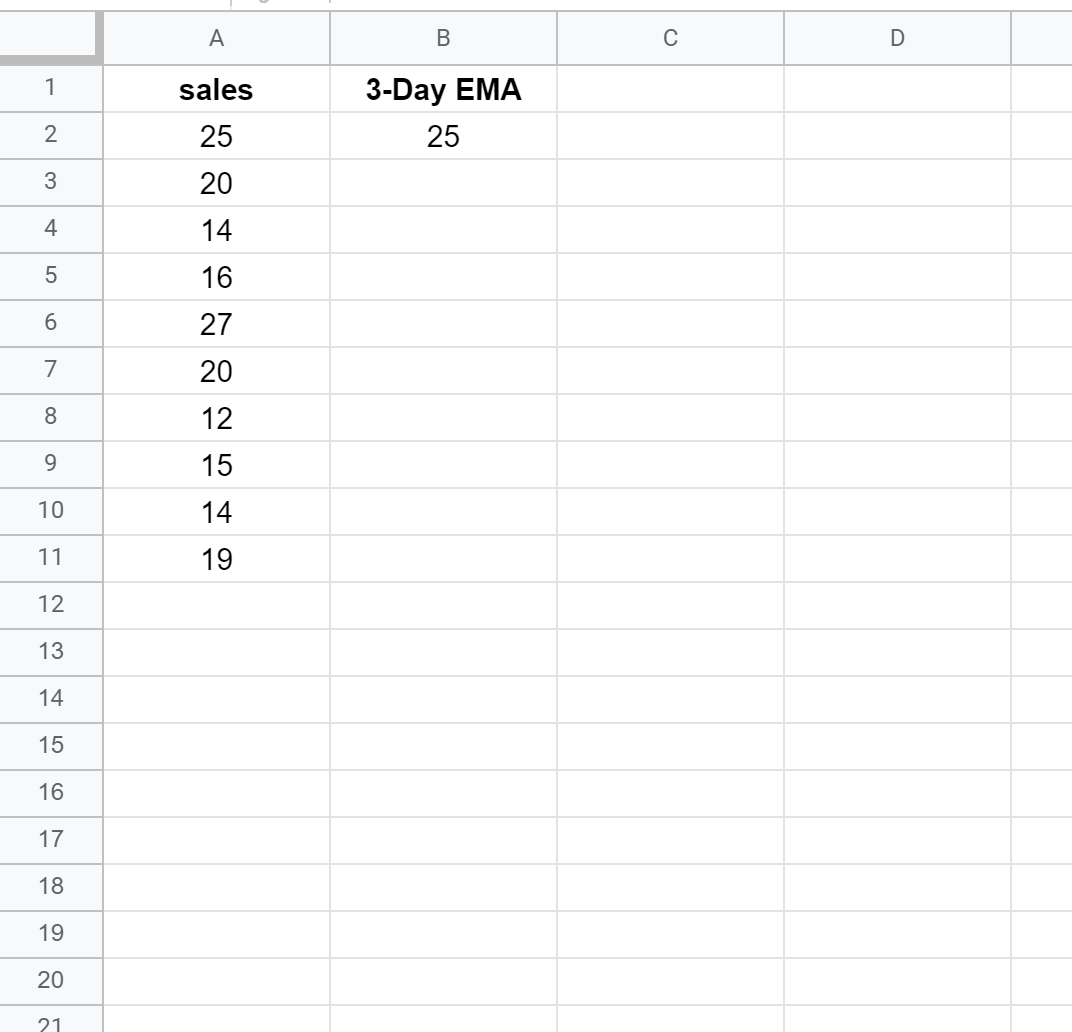
For our example, we’ll calculate a 3-day EMA. First, we’ll enter the EMA value in cell B2 to be equal to the value in cell A2:
Next, we’ll use the following formula to calculate the first value for the 3-day EMA:
Next, hover over the bottom right corner of cell B3 until a tiny “+” cross appears. Double click the cross to copy and paste the formula down to the remaining cells in the column:
That’s it! Column A shows the sales and column B shows the 3-day exponential moving average of the sales.
You can find more Google Sheets tutorials on this page.


