An intraclass correlation coefficient (ICC) is used to determine if items (or subjects) can be rated reliably by different raters.
The value of an ICC can range from 0 to 1, with 0 indicating no reliability among raters and 1 indicating perfect reliability.
This tutorial provides a step-by-step example of how to calculate ICC in Excel.
Step 1: Create the Data
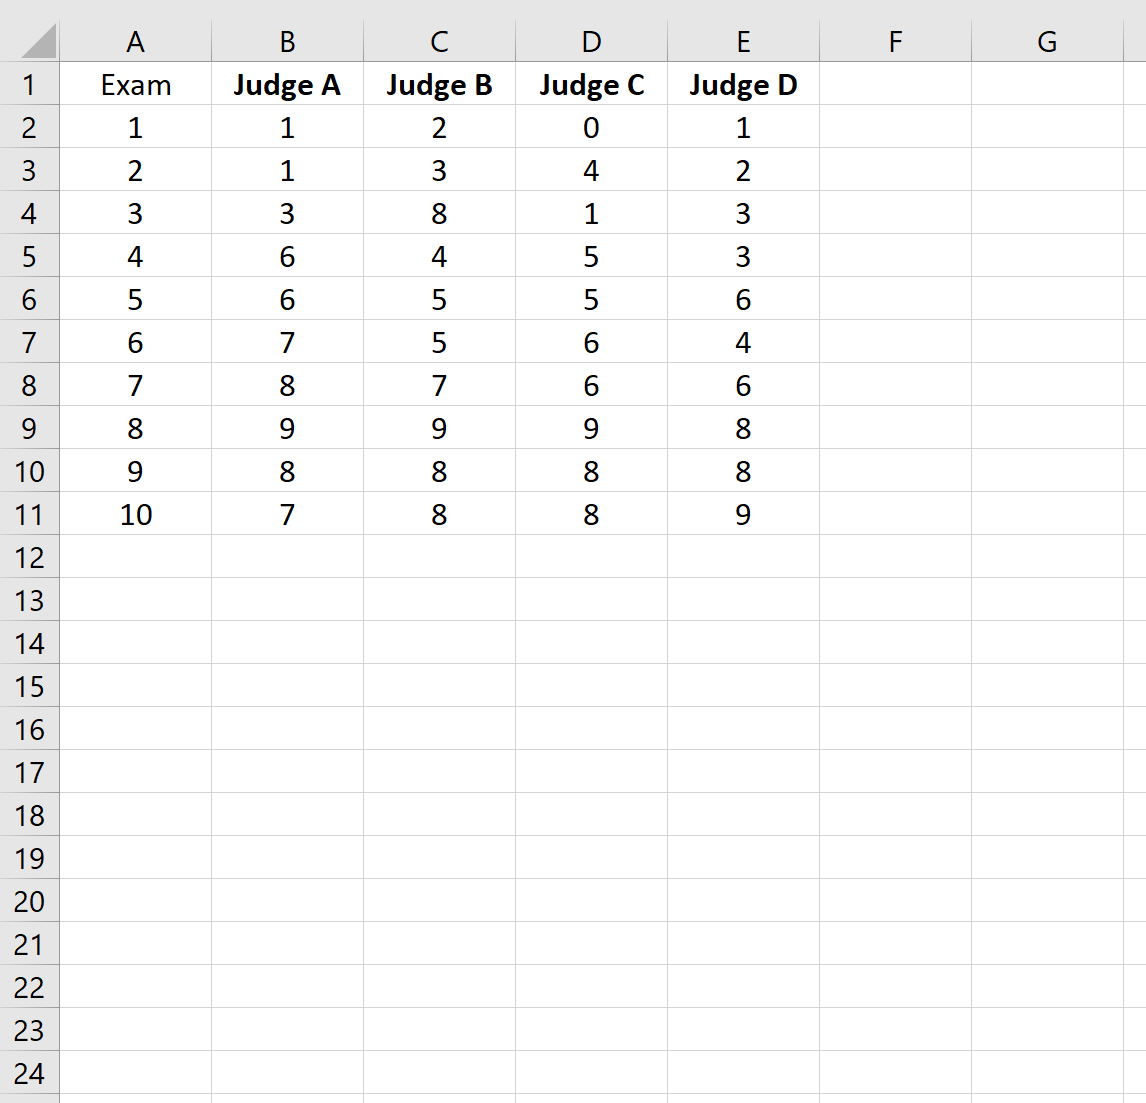
Suppose four different judges were asked to rate the quality of 10 different college entrance exams. The results are shown below:
Step 2: Fit an ANOVA
In order to calculate the ICC for these ratings, we first need to fit an Anova: Two-Factor Without Replication.
To do so, highlight cells A1:E11 as follows:
To do so, click the Data tab along the top ribbon and then click the Data Analysis option under the Analysis group:
If you don’t see this option available, you need to first load the Analysis ToolPak.
In the dropdown menu that appears, click Anova: Two-Factor Without Replication and then click OK. In the new window that appears, fill in the following information and then click OK:
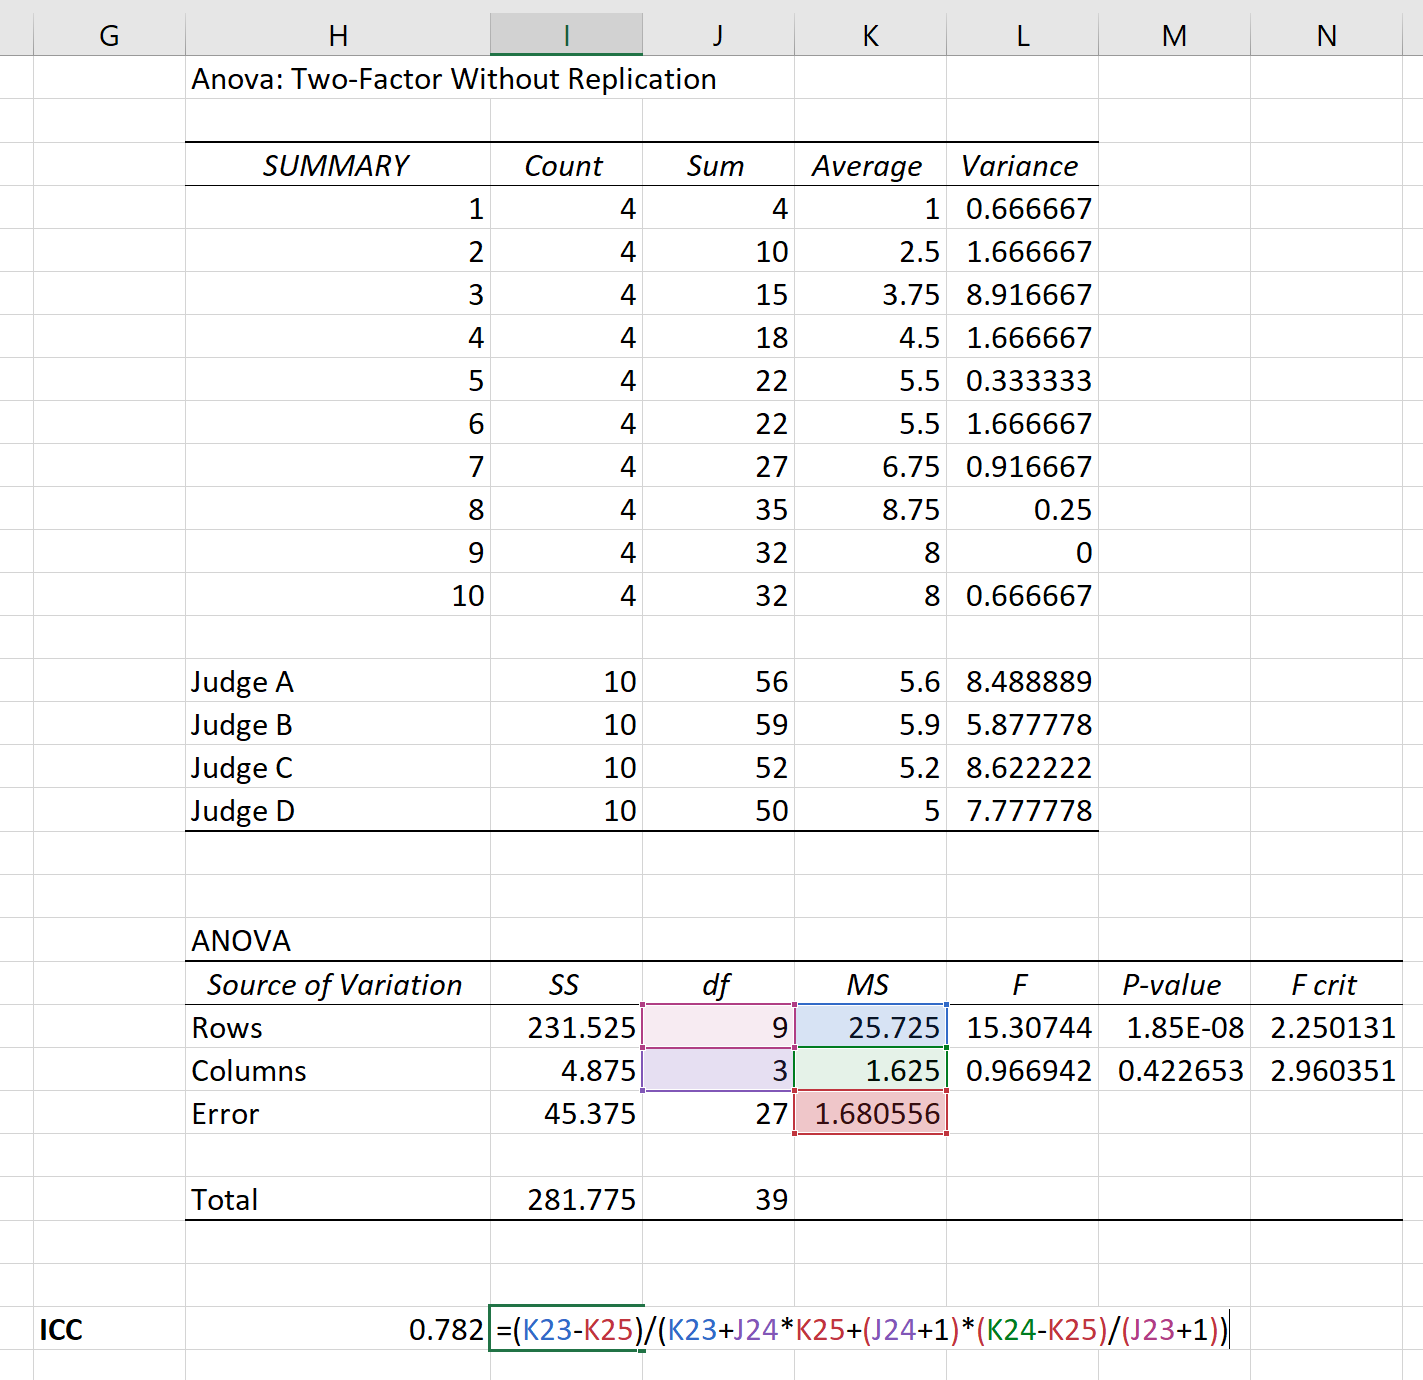
The following results will appear:
Step 3: Calculate the Intraclass Correlation Coefficient
We can use the following formula to calculate the ICC among the raters:
The intraclass correlation coefficient (ICC) turns out to be 0.782.
Here is how to interpret the value of an intraclass correlation coefficient, according to Koo & Li:
- Less than 0.50: Poor reliability
- Between 0.5 and 0.75: Moderate reliability
- Between 0.75 and 0.9: Good reliability
- Greater than 0.9: Excellent reliability
Thus, we would conclude that an ICC of 0.782 indicates that the exams can be rated with “good” reliability by different raters.
A Note on Calculating ICC
There are several different versions of an ICC that can be calculated, depending on the following three factors:
- Model: One-Way Random Effects, Two-Way Random Effects, or Two-Way Mixed Effects
- Type of Relationship: Consistency or Absolute Agreement
- Unit: Single rater or the mean of raters
In the previous example, the ICC that we calculated used the following assumptions:
- Model: Two-Way Random Effects
- Type of Relationship: Absolute Agreement
- Unit: Single rater
For a detailed explanation of these assumptions, please refer to this article.


