Often in statistics we’re interested in measuring population parameters – numbers that describe some characteristic of an entire population.
Two of the most common population parameters are:
1. Population mean: the mean value of some variable in a population (e.g. the mean height of males in a certain city)
2. Population proportion: the proportion of some variable in a population (e.g. the proportion of residents in a county who support a certain law)
Although we’re interested in measuring these parameters, it’s usually too costly and time-consuming to actually go around and collect data on every individual in a population.
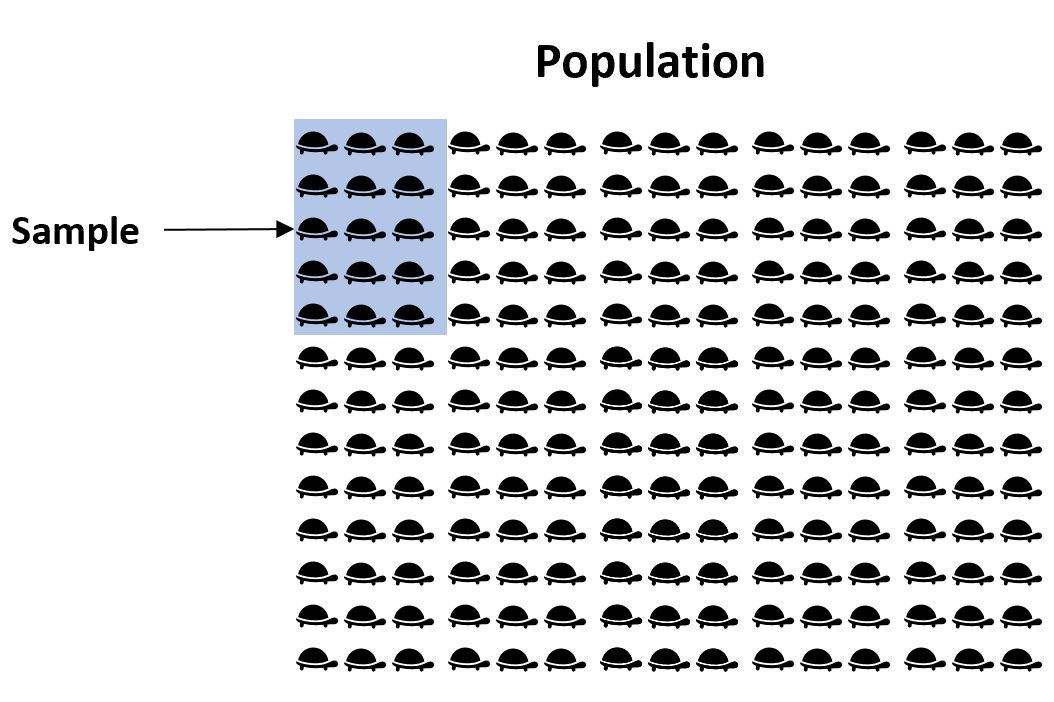
Instead, we take a random sample from the population and use data from the sample to estimate the population parameter.
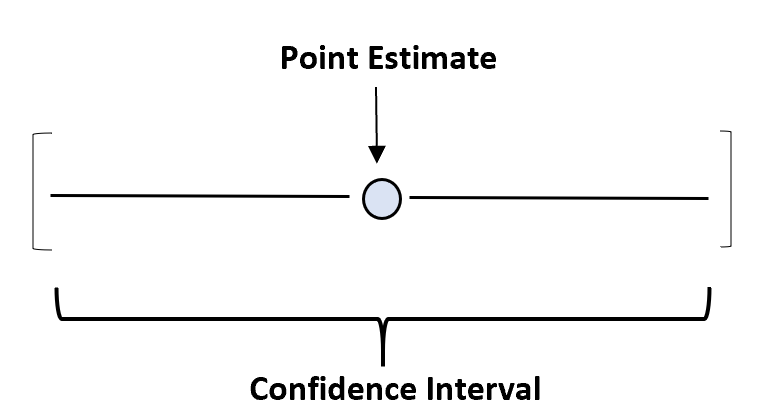
The number that we use from the sample to estimate the population parameter is known as the point estimate. This serves as our best possible estimate of what the true population parameter may be.
The following table shows the point estimate that we use to estimate the population parameters:
| Measurement | Population parameter | Point estimate |
|---|---|---|
| Mean | μ (population mean) | x (sample mean) |
| Proportion | π (population proportion) | p (sample proportion) |
We are interested in calculating the population parameters but since it’s too time-consuming and costly to do, we instead use samples to calculate point estimates.
For example, suppose we want to estimate the mean weight of a certain species of turtle in Florida. Since there are thousands of turtles in Florida, it would be extremely time-consuming and costly to go around and weigh each individual turtle. Instead, we might take a simple random sample of 50 turtles and use the mean weight of the turtles in this sample to estimate the true population mean:
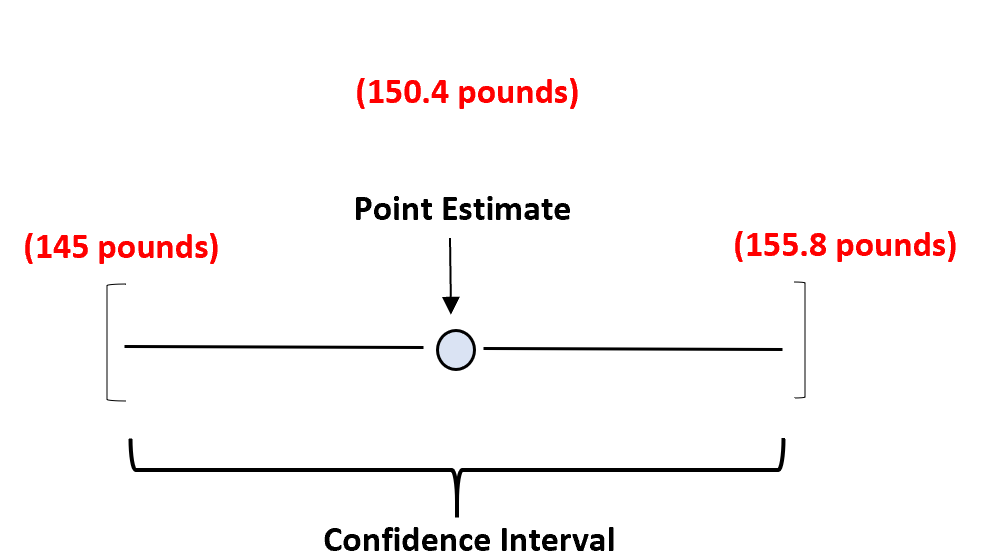
If the sample mean is 150.4 pounds, then our point estimate for the true population mean of the entire species would be 150.4 pounds.
The Importance of Representative Samples
When we collect a sample from a population, we ideally want the sample to be like a “mini version” of our population.
We say that a sample is representative of a population if the characteristics of the individuals in the sample closely matches the characteristics of the individuals in the overall population.
When this occurs, we can generalize the findings from the sample to the overall population with confidence and we can say that the point estimate from the sample is an unbiased estimate of the true population parameter.
Point Estimates & Confidence Intervals
Although a point estimate represents our best possible estimate of some true population parameter, it’s unlikely that it will exactly match the population parameter.
In our previous example, the mean weight of turtles in the sample is not guaranteed to exactly match the mean weight of turtles in the whole population. For example, we might just happen to pick a sample full of low-weight turtles or perhaps a sample full of heavy turtles.
So, to capture this uncertainty we can create a confidence interval – a range of values that is likely to contain a population parameter with a certain level of confidence.
For example, we may use our sample mean of 150.4 pounds to estimate the true average weight of a species of turtles. Our confidence interval would then be a range of values – perhaps 145 pounds to 155.8 pounds.
Our point estimate is our best estimate of the true population mean weight and the confidence interval provides a range of values that is likely to contain the true population mean weight.
You can read more about confidence intervals here.
Additional Resources
Statistic vs. Parameter: What’s the Difference?
Population vs. Sample: What’s the Difference?
An Introduction to Confidence Intervals


