A residual is the difference between an observed value and a predicted value in a regression model.
It is calculated as:
Residual = Observed value – Predicted value
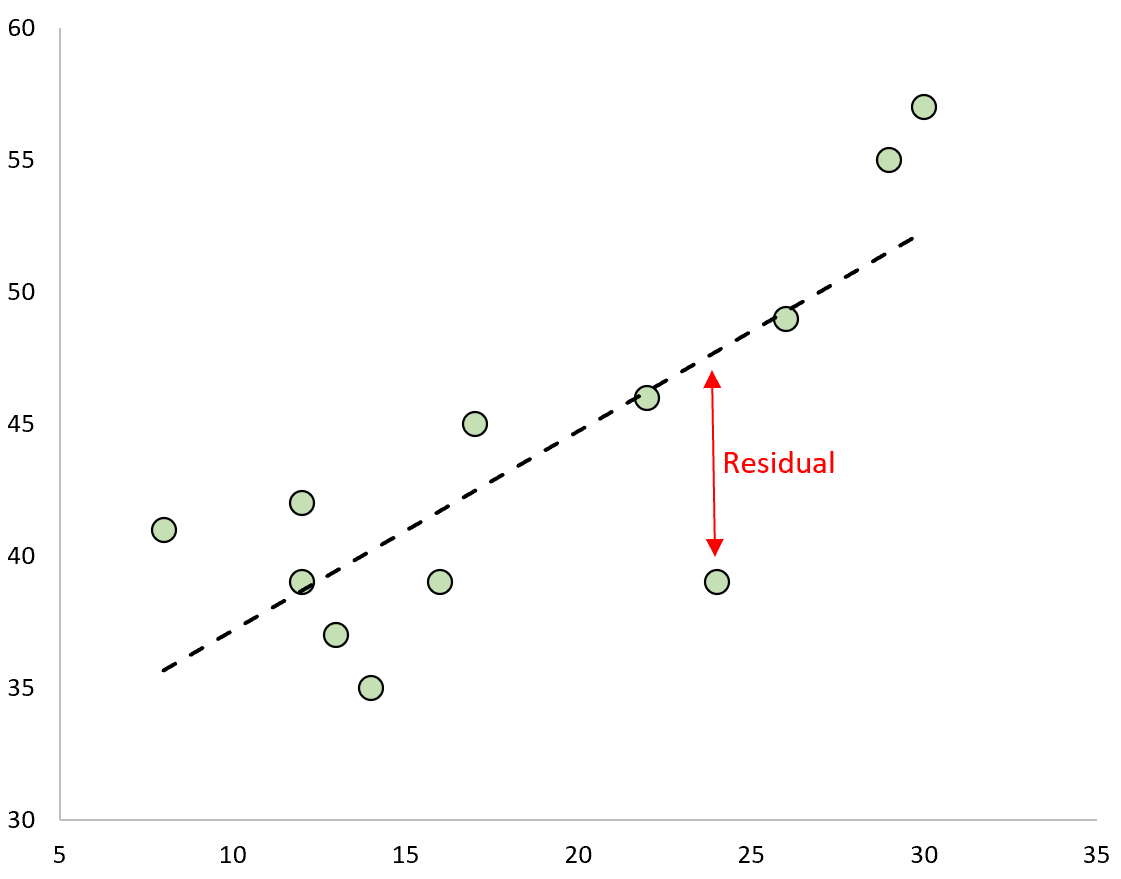
If we plot the observed values and overlay the fitted regression line, the residuals for each observation would be the vertical distance between the observation and the regression line:
One type of residual we often use to identify outliers in a regression model is known as a standardized residual.
It is calculated as:
ri = ei / s(ei) = ei / RSE√1-hii
where:
- ei: The ith residual
- RSE: The residual standard error of the model
- hii: The leverage of the ith observation
In practice, we often consider any standardized residual with an absolute value greater than 3 to be an outlier.
This tutorial provides a step-by-step example of how to calculate standardized residuals in Excel.
Step 1: Enter the Data
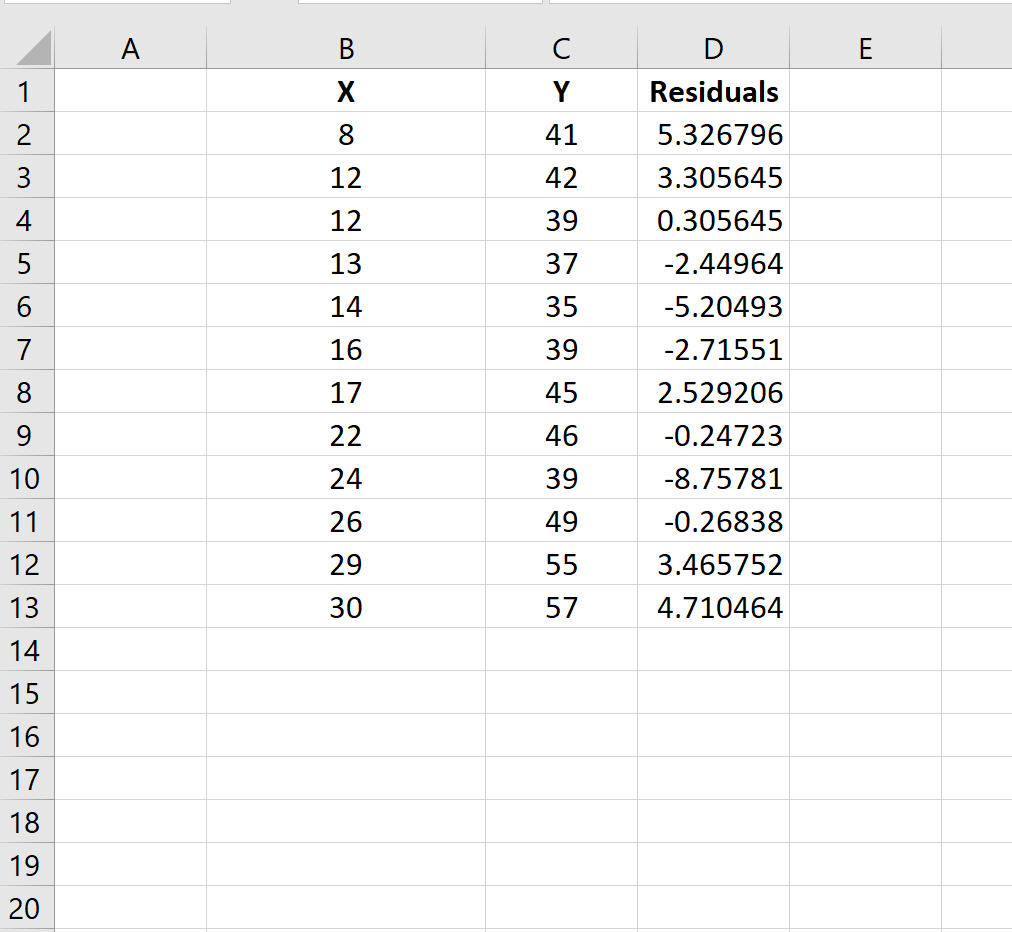
First, we’ll enter the values for a small dataset into Excel:
Step 2: Calculate the Residuals
Next, we’ll go to the Data tab along the top ribbon and click Data Analysis within the Analysis group:
If you haven’t installed this Add-in already, check out this tutorial on how to do so. It’s easy to install and completely free.
Once you’ve clicked Data Analysis, click the option that says Regression and then click OK. In the new window that pops up, fill in the following information and click OK:
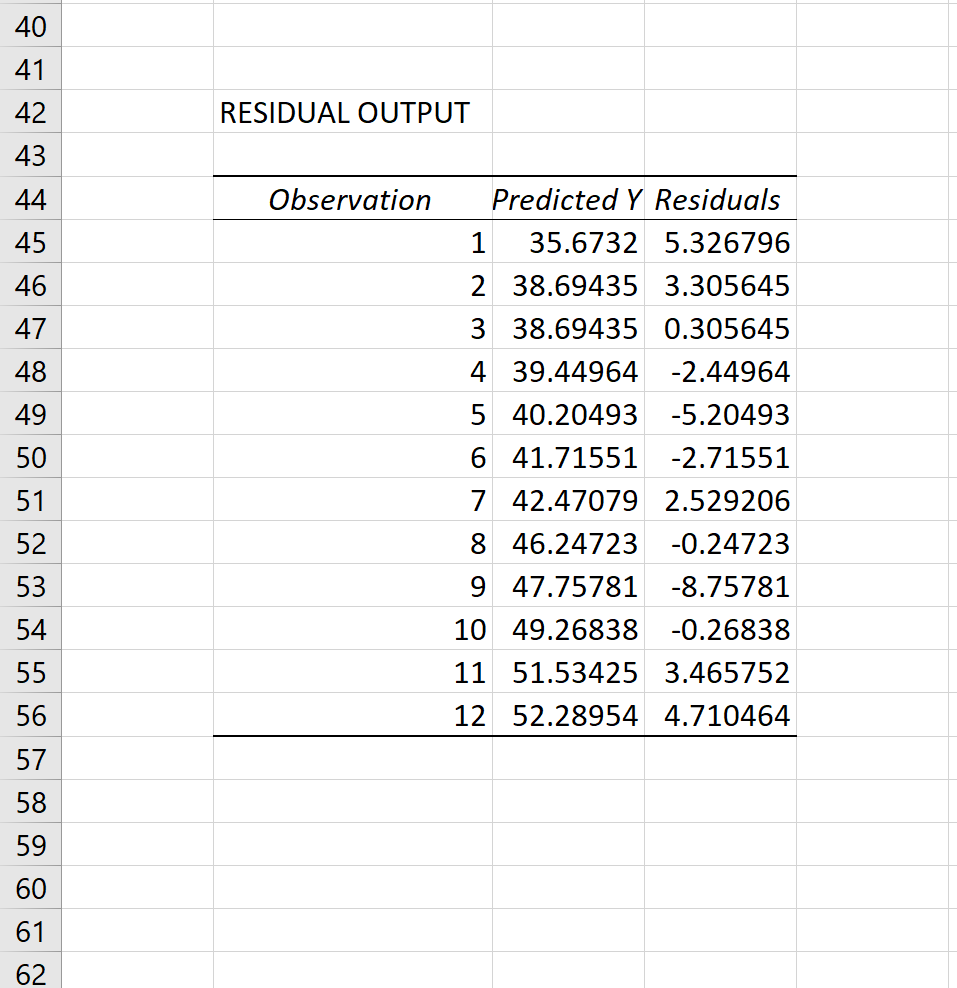
The residual for each observation will appear in the output:
Copy and paste these residuals in a new column next to the original data:
Step 3: Calculate the Leverage
Next, we need to calculate the leverage of each observation.
The following image shows how to do so:
Here are the formulas used in the various cells:
- B14: =COUNT(B2:B13)
- B15: =AVERAGE(B2:B13)
- B16: =DEVSQ(B2:B13)
- E2: =1/$B$14+(B2-$B$15)^2/$B$16
Step 4: Calculate the Standardized Residuals
Lastly, we can calculate the standardized residuals using the formula:
ri = ei / RSE√1-hii
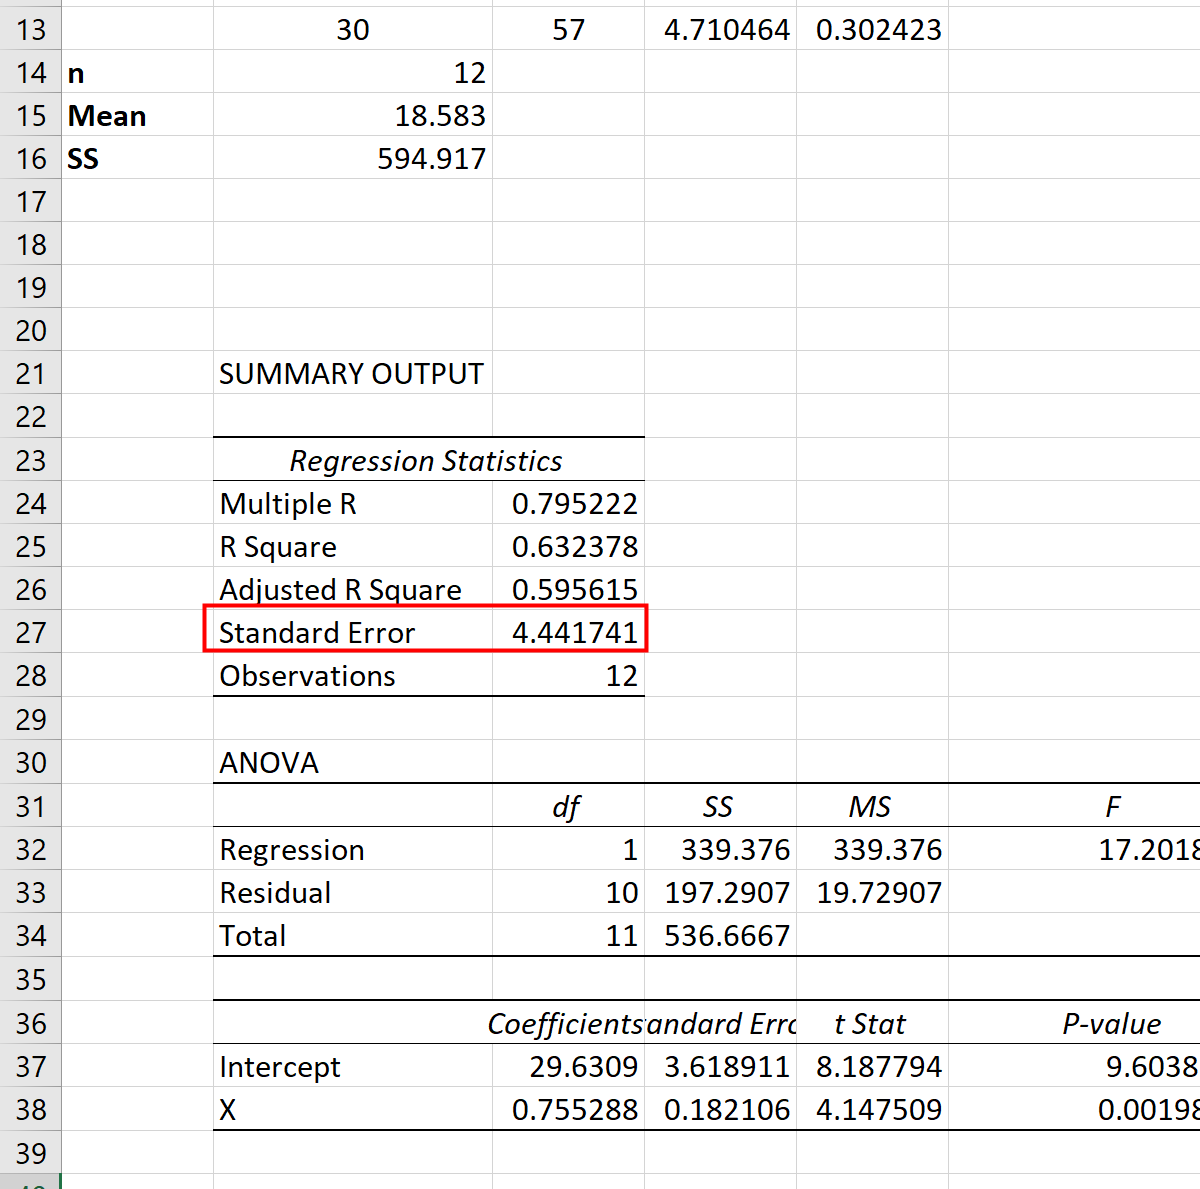
The RSE for the model can be found in the model output from earlier. It turns out to be 4.44:
Thus, we can use the following formula to calculate the standardized residual for each observation:
From the results we can see that none of the standardized residuals exceed an absolute value of 3. Thus, none of the observations appear to be outliers.
It’s worth noting in some cases that researchers consider observations with standardized residuals that exceed an absolute value of 2 to be considered outliers.
It’s up to you to decide whether to use an absolute value of 2 or 3 as the threshold for outliers, depending on the specific problem you’re working on.
Additional Resources
What Are Residuals?
What Are Standardized Residuals?
Introduction to Multiple Linear Regression


