A quiver plot is a type of plot that displays arrows with directional components U and V at the Cartesian coordinates specified by X and Y.
We can easily create a quiver plot in Matplotlib by using the quiver() function, which uses the following syntax:
quiver(x, y, u, v)
where:
- x: The x-coordinates of the arrow locations
- y: The y-coordinates of the arrow locations
- u: The x components of the arrow vectors
- v: The y components of the arrow vectors
This tutorial provides several examples of how to use this function in practice.
Example 1: Quiver Plot with One Arrow
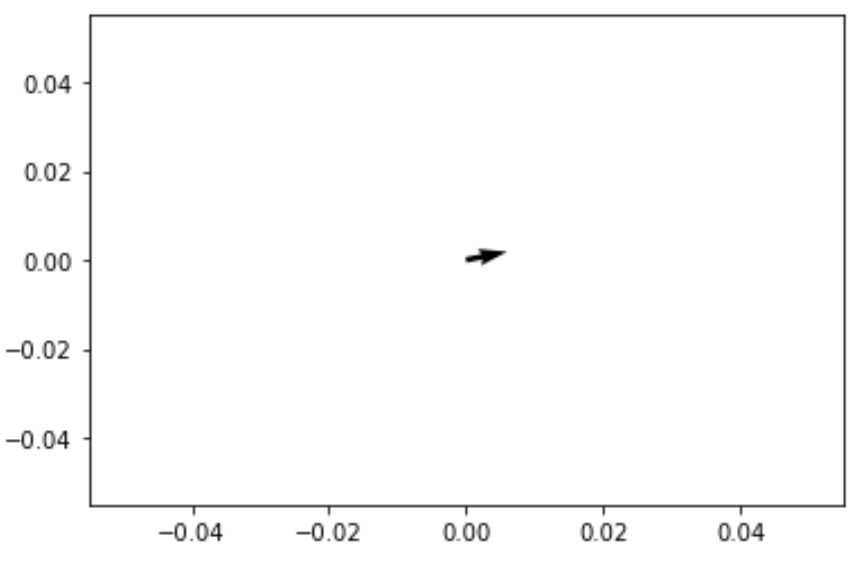
The following code shows how to display a quiver plot with just one arrow:
import matplotlib.pyplot as plt

#define plots
fig, ax = plt.subplots()

#define coordinates and directions
x = 0
y = 0
u = 15
v = 3

#create quiver plot
ax.quiver(x, y, u, v)

#display quiver plot
plt.show()
Example 2: Quiver Plot with Two Arrows
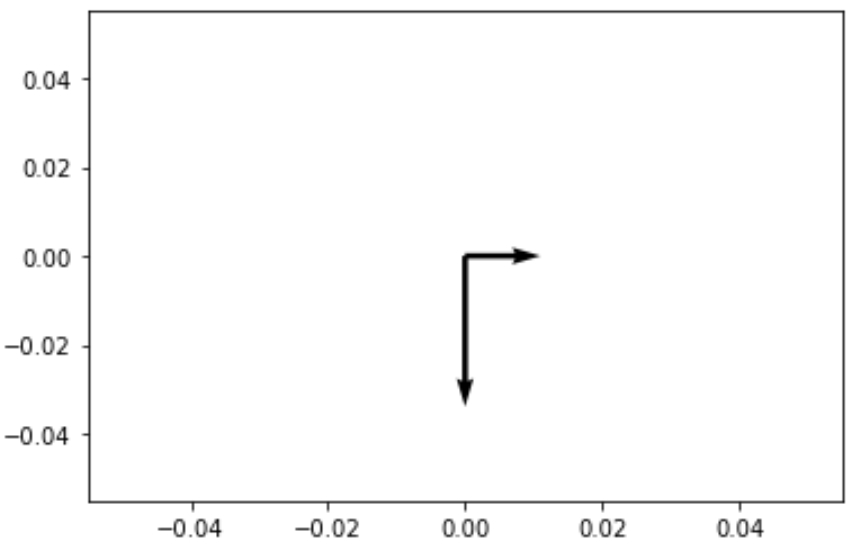
The following code shows how to display a quiver plot with two arrows:
import matplotlib.pyplot as plt

#define plots
fig, ax = plt.subplots()

#define coordinates and directions
x = [0, 0]
y = [0, 0]
u = [0, 1]
v = [-2, 0]
#create quiver plot
ax.quiver(x, y, u, v, scale = 10)

#display quiver plot
plt.show()
Note that the scale argument scales the arrows to be longer, which makes them easier to view on the plot.
Example 3: Quiver Plot with a Mesh Grid
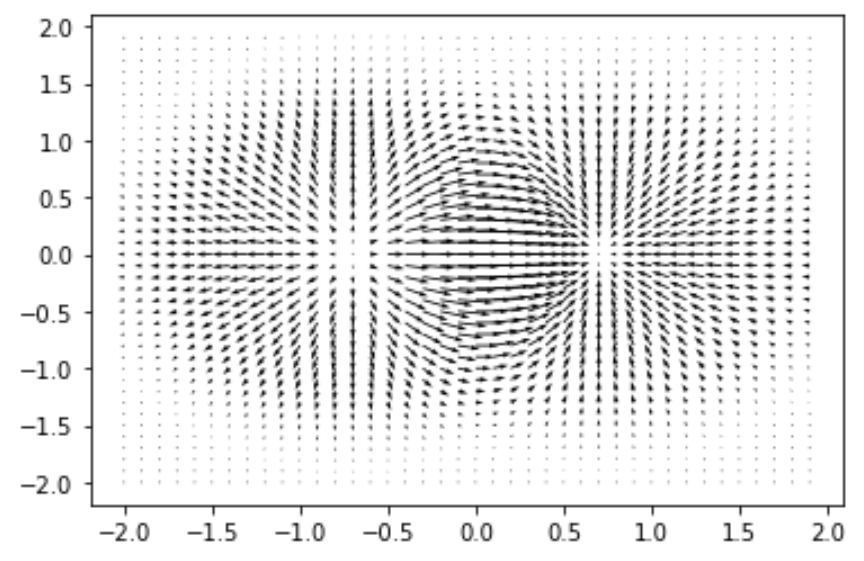
The following code shows how to display a quiver plot using a mesh grid:
import matplotlib.pyplot as plt
import numpy as np

#define plots
fig, ax = plt.subplots()

#define coordinates and directions
x,y = np.meshgrid(np.arange(-2, 2, .1), np.arange(-2, 2, .1))
z = x*np.exp(-x**2 - y**2)
v, u = np.gradient(z, .1, .1)

#create quiver plot
ax.quiver(x, y, u, v)

#display quiver plot
plt.show()
You can find the complete documentation for the quiver() function here.


