A repeated measures ANOVA is used to determine whether or not there is a statistically significant difference between the means of three or more groups in which the same subjects show up in each group.
A repeated measures ANOVA is typically used in two specific situations:
1. Measuring the mean scores of subjects during three or more time points. For example, you might want to measure the resting heart rate of subjects one month before they start a training program, during the middle of the training program, and one month after the training program to see if there is a significant difference in mean resting heart rate across these three time points.
Notice how the same subjects show up at each time point. We repeatedly measured the same subjects, hence the reason why we used a repeated measures ANOVA.
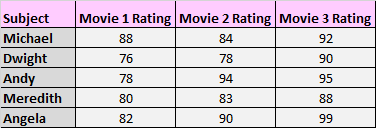
2. Measuring the mean scores of subjects under three different conditions. For example, you might have subjects watch three different movies and rate each one based on how much they enjoyed it.
Again, the same subjects show up in each group, so we need to use a repeated measures ANOVA to test for the difference in means across these three conditions.
One-Way ANOVA vs. Repeated Measures ANOVA
In a typical one-way ANOVA, different subjects are used in each group. For example, we might ask subjects to rate three movies, just like in the example above, but we use different subjects to rate each movie:
In this case, we would conduct a typical one-way ANOVA to test for the difference between the mean ratings of the three movies.
In real life there are two benefits of using the same subjects across multiple treatment conditions:
1. It’s cheaper and faster for researchers to recruit and pay a smaller number of people to carry out an experiment since they can just obtain data from the same people multiple times.
2. We are able to attribute some of the variance in the data to the subjects themselves, which makes it easier to obtain a smaller p-value.
One potential drawback of this type of design is that subjects might get bored or tired if an experiment lasts too long, which could skew the results. For example, subjects might give lower movie ratings to the third movie they watch because they’re tired and ready to go home.
Repeated Measures ANOVA: Example
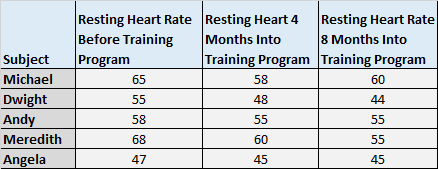
Suppose we recruit five subjects to participate in a training program. We measure their resting heart rate before participating in a training program, after participating for 4 months, and after participating for 8 months.
The following table shows the results:
We want to know whether there is a difference in mean resting heart rate at these three time points so we conduct a repeated measures ANOVA at the .05 significance level using the following steps:
Step 1. State the hypotheses.
The null hypothesis (H0): µ1 = µ2 = µ3 (the population means are all equal)
The alternative hypothesis: (Ha): at least one population mean is different from the rest
Step 2. Perform the repeated measures ANOVA.
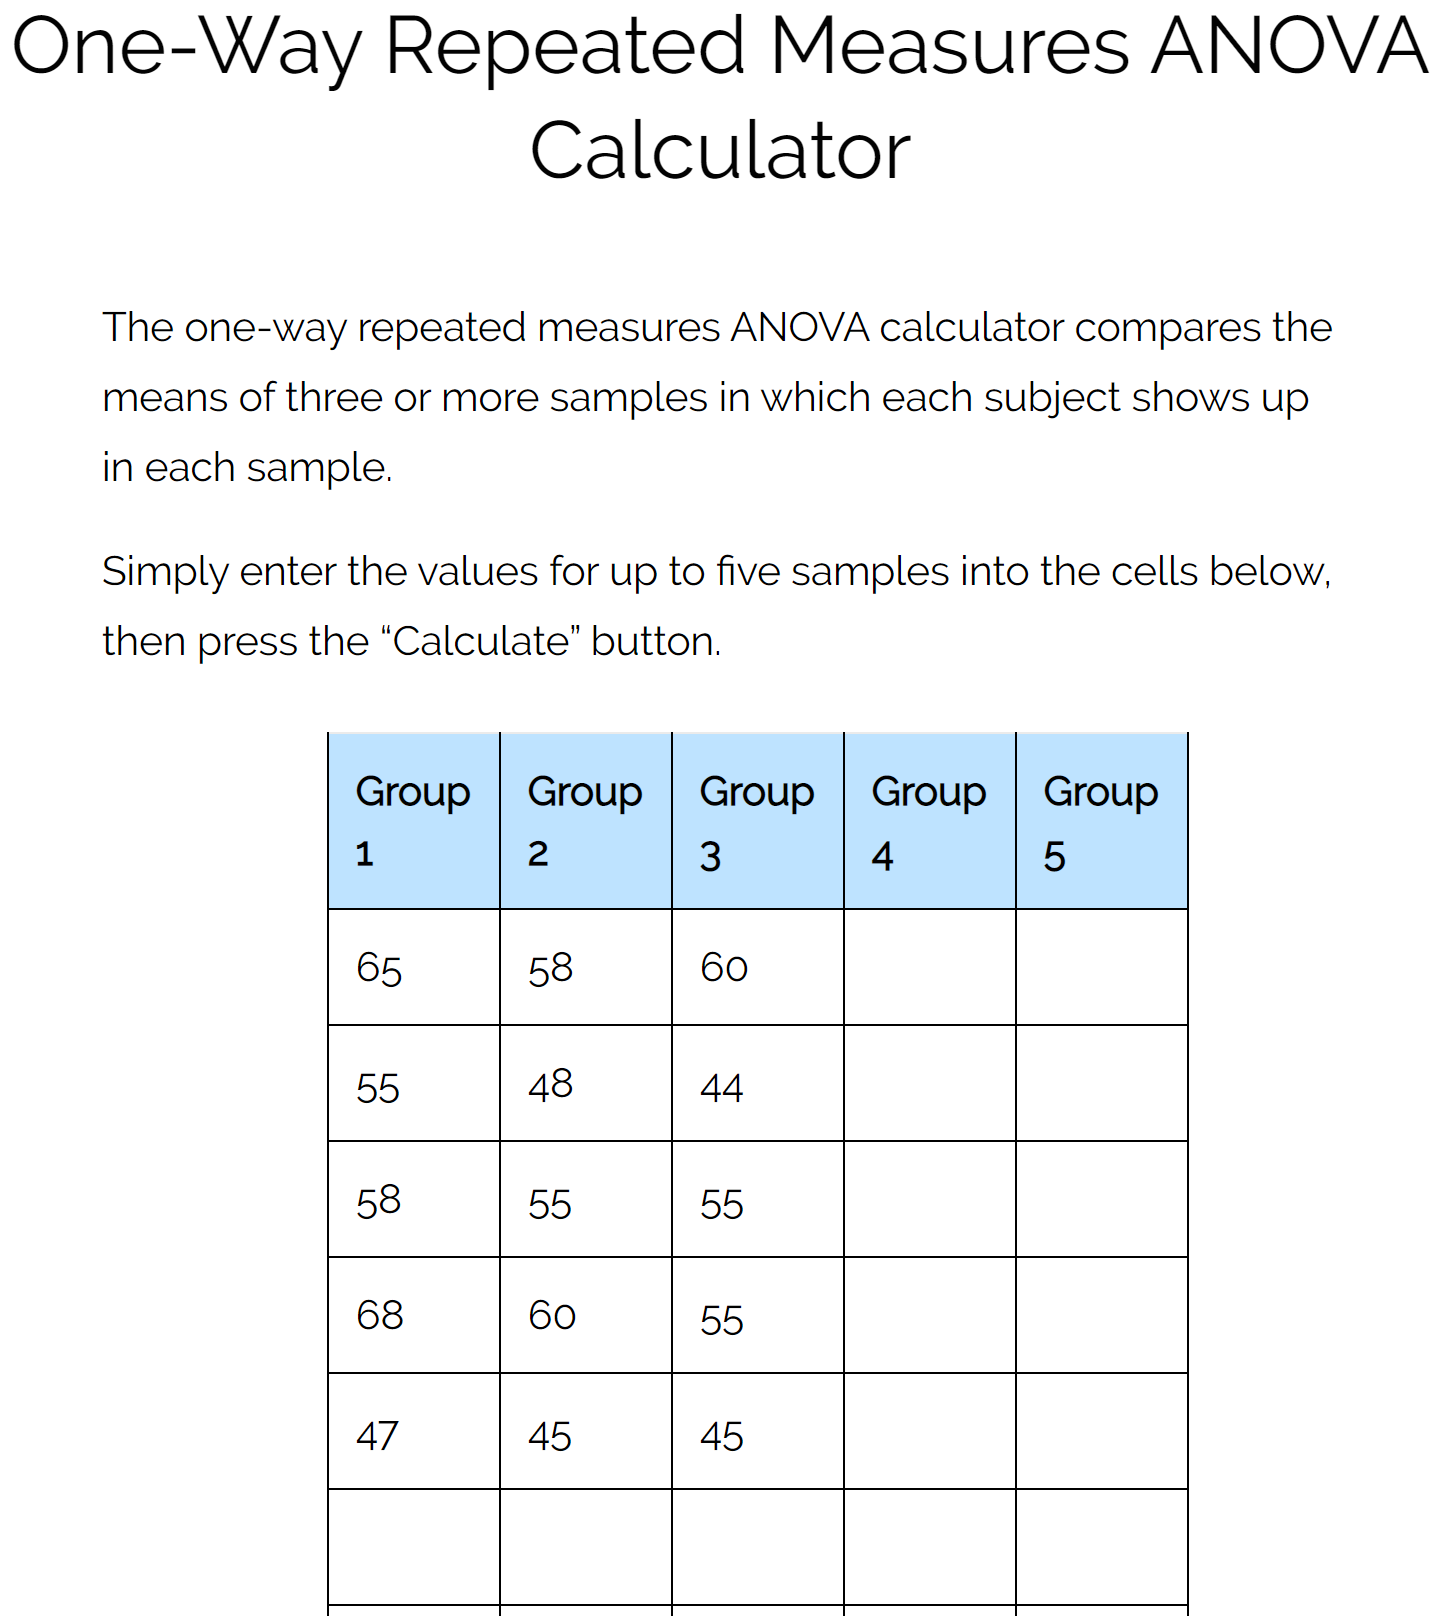
We will use the Repeated Measures ANOVA Calculator using the following input:
Once we click “Calculate” then the following output will automatically appear:
Step 3. Interpret the results.
From the output table we see that the F test statistic is 9.598 and the corresponding p-value is 0.00749.
Since this p-value is less than 0.05, we reject the null hypothesis. This means we have sufficient evidence to say that there is a statistically significant difference between the mean resting heart rate at the three different points in time.
Additional Resources
The following articles explain how to perform a repeated measures ANOVA using different statistical softwares:
Repeated Measures ANOVA in Excel
Repeated Measures ANOVA in R
Repeated Measures ANOVA in Stata
Repeated Measures ANOVA in Python
Repeated Measures ANOVA in SPSS
Repeated Measures ANOVA in Google Sheets
Repeated Measures ANOVA By Hand
Repeated Measures ANOVA Calculator


