The easiest way to create a 3D plot in R is to use the persp() function.
persp(x, y, z)
The following examples show how to use this function in practice.
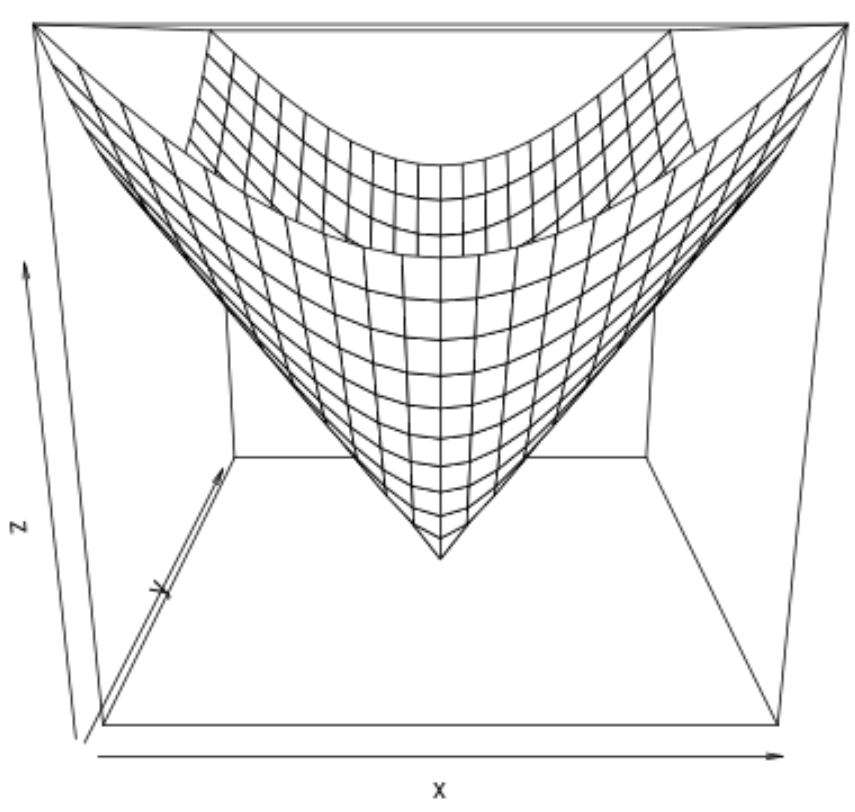
Example 1: Basic 3D Plot
The following code shows how to create a basic 3D plot:
#define x and y
x #define function to create z-values
z_values function(x, y) {
  sqrt(x ^ 2 + y ^ 2)
}

#create z-values
z = outer(x, y, z_values)

#create 3D plot
persp(x, y, z)
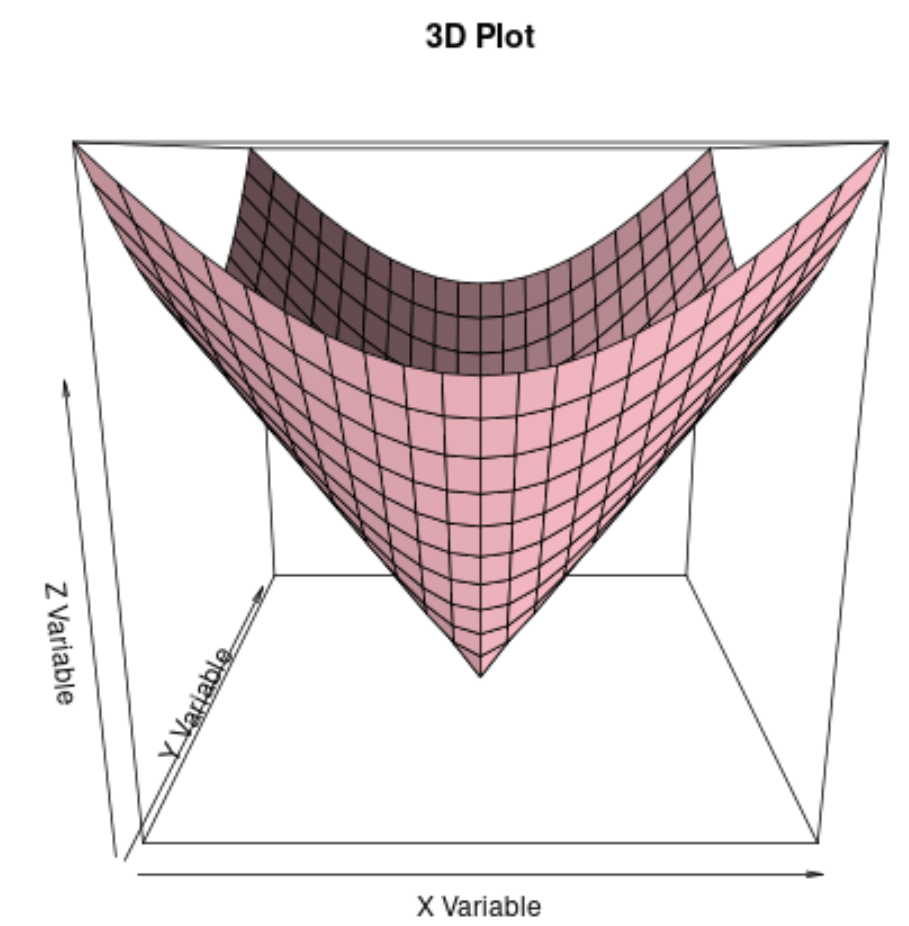
Example 2: Custom 3D Plot
The following code shows how to customize the axis labels, title, color, and shade of the plot:
#define x and y
x #define function to create z-values
z_values function(x, y) {
  sqrt(x ^ 2 + y ^ 2)
}

#create z-values
z = outer(x, y, z_values)

#create 3D plot
persp(x, y, z, xlab='X Variable', ylab='Y Variable', zlab='Z Variable',
      main='3D Plot', col='pink', shade=.4)
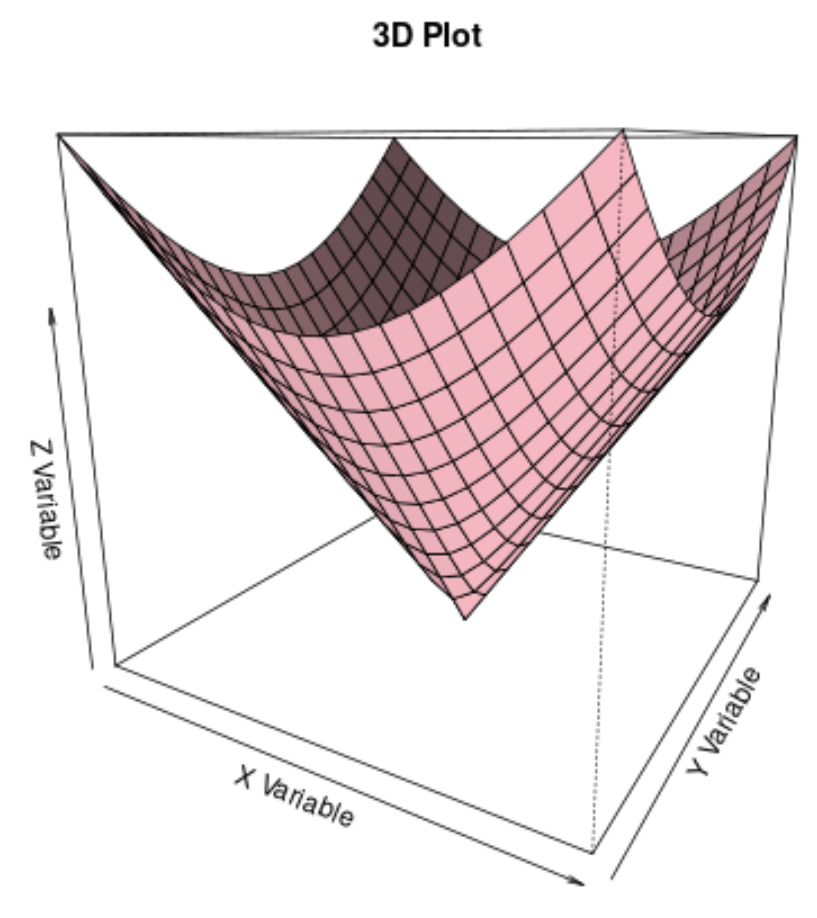
Example 3: Rotate the 3D Plot
The following code shows how to rotate the 3D plot to make it easier to view, using the theta and phi arguments:
#define x and y
x #define function to create z-values
z_values function(x, y) {
  sqrt(x ^ 2 + y ^ 2)
}

#create z-values
z = outer(x, y, z_values)

#create 3D plot
persp(x, y, z, xlab='X Variable', ylab='Y Variable', zlab='Z Variable',
      main='3D Plot', col='pink', shade=.4, theta = 30, phi = 15)
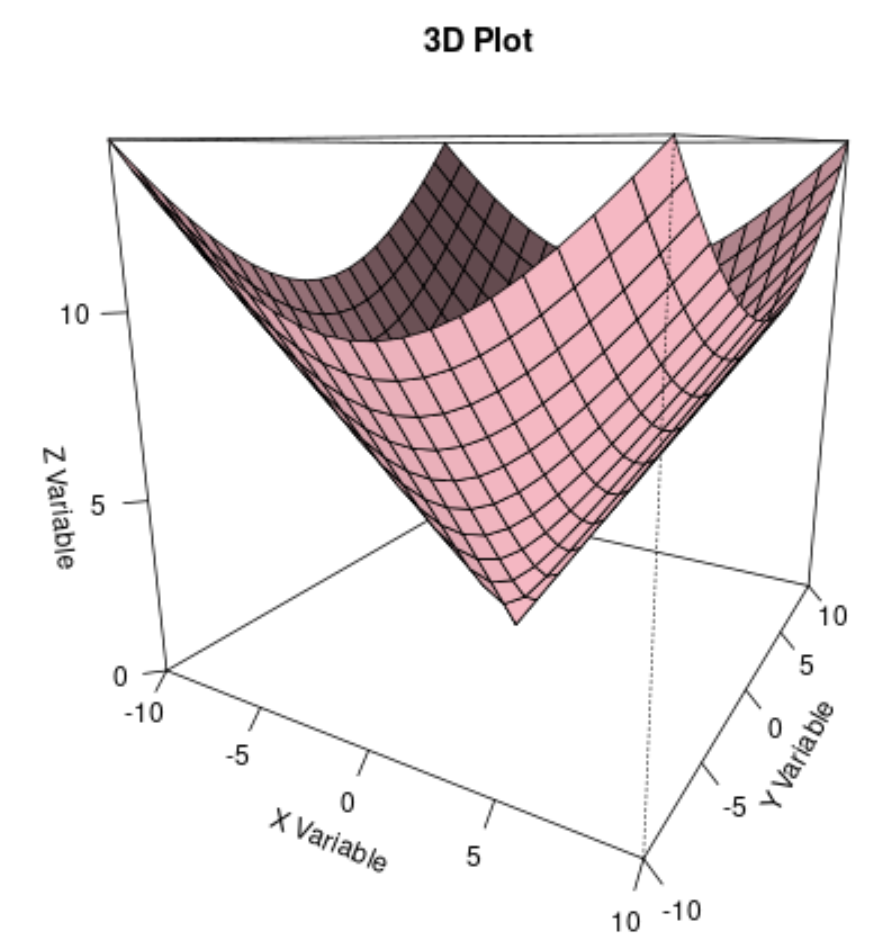
Example 4: Add Tick Marks to the 3D Plot
The following code shows how to use the ticktype argument to add tick marks with labels to each axis:
#define x and y
x #define function to create z-values
z_values function(x, y) {
  sqrt(x ^ 2 + y ^ 2)
}

#create z-values
z = outer(x, y, z_values)

#create 3D plot
persp(x, y, z, xlab='X Variable', ylab='Y Variable', zlab='Z Variable',
      main='3D Plot', col='pink', shade=.4, theta = 30, phi = 15, ticktype='detailed')
Additional Resources
The following tutorials explain how to create other common charts in R:
How to Plot Multiple Lines in One Chart in R
How to Plot Multiple Boxplots in One Chart in R
How to Create a Pareto Chart in R
How to Create Radar Charts in R